Soil Microbiome Restoration in Arid Agriculture: A Field Protocol for Live-Microbial Inputs
Soil Microbiome Restoration in Arid Agriculture: A Field Protocol for Live-Microbial Inputs
Executive summary
Arid and semi-arid soils underpin roughly 40 percent of global agricultural production yet host the lowest soil organic carbon stocks and the most fragile microbial communities of any biome (FAO 2015; Plaza et al. 2018). Decades of synthetic-only fertilization, irrigation with marginal-quality water, and high evapotranspiration have driven a slow, mostly invisible collapse of belowground biology. The downstream symptoms are familiar to every agronomist working the Gulf, North Africa, southern Africa, the Iberian peninsula, the Indian subcontinent, and the inland basins of Australia and the Americas: yields stagnant or declining despite rising input rates, infiltration falling, salts climbing, water bills compounding faster than commodity prices.
This whitepaper sets out a practitioner field protocol for restoring soil microbial function using a live-microbial liquid input — Magic Power, a fish-manure-derived biological residue with NPK that combines plant-available macronutrients with a viable microbial inoculum and its associated metabolites. The protocol is designed to be run as a controlled, replicated trial inside a working commercial farm, comparing treated blocks against the farm's current standard of practice. It is appropriate for greenhouse, open-field horticulture, perennial fruit, vineyard, and arable systems in arid and semi-arid climates.
The document specifies (1) a pre-trial baseline measurement covering soil organic carbon, microbial biomass carbon, basal respiration, aggregate stability, infiltration rate, water-holding capacity, electrical conductivity, and a yield-per-input baseline; (2) an application protocol including dilution at 1 L of concentrate per 1,000 L of irrigation water, recommended timings, and per-hectare volumes for drip and pivot systems; (3) a mid-trial measurement schedule at three, six, and twelve months; (4) interpretation guidance for typical season-one through season-three trajectories; (5) common pitfalls and their mitigations; and (6) representative case studies from a UAE arid greenhouse, a South African stone-fruit orchard, and a Czech Republic vineyard.
The intent is not to advocate. It is to give an agronomist enough operational detail to run a trial on their own land, on their own crops, with their own equipment, and to know — with measurable confidence — whether live-microbial inputs are improving their soil before they make a multi-season commitment.
1. The microbiome problem in arid-land agriculture
Arid and semi-arid soils are not depauperate by accident. They are the slow output of climates where mean annual precipitation rarely exceeds 400 mm, evapotranspiration regularly exceeds 1,500 mm, and net primary productivity — the carbon input that ultimately feeds belowground life — is structurally low. Under those conditions, soil organic carbon (SOC) stocks in the upper 30 cm typically range from 0.3 to 1.2 percent by mass in cultivated land, against 2 to 4 percent in temperate systems with comparable management (Plaza et al. 2018; Lal 2004). The microbial biomass carbon (MBC) that those SOC stocks support is correspondingly small — often below 200 mg C per kg of dry soil, against 500 to 900 mg C/kg in productive temperate cropland (Bardgett & van der Putten 2014).
When these soils are drawn into intensive irrigated agriculture, three reinforcing pressures accelerate microbial collapse. The first is carbon starvation. Synthetic NPK delivers nitrogen, phosphorus, and potassium to the plant but adds no organic substrate to the soil. With residue removal common — through grazing, burning, or mechanical clearing — the carbon flux that would otherwise feed heterotrophic bacteria, fungi, and protists is interrupted. Microbial communities respond by contracting, simplifying, and shifting toward stress-tolerant, less metabolically diverse assemblages (Fierer 2017). Functional redundancy — the property that protects soil ecosystems against perturbation — falls.
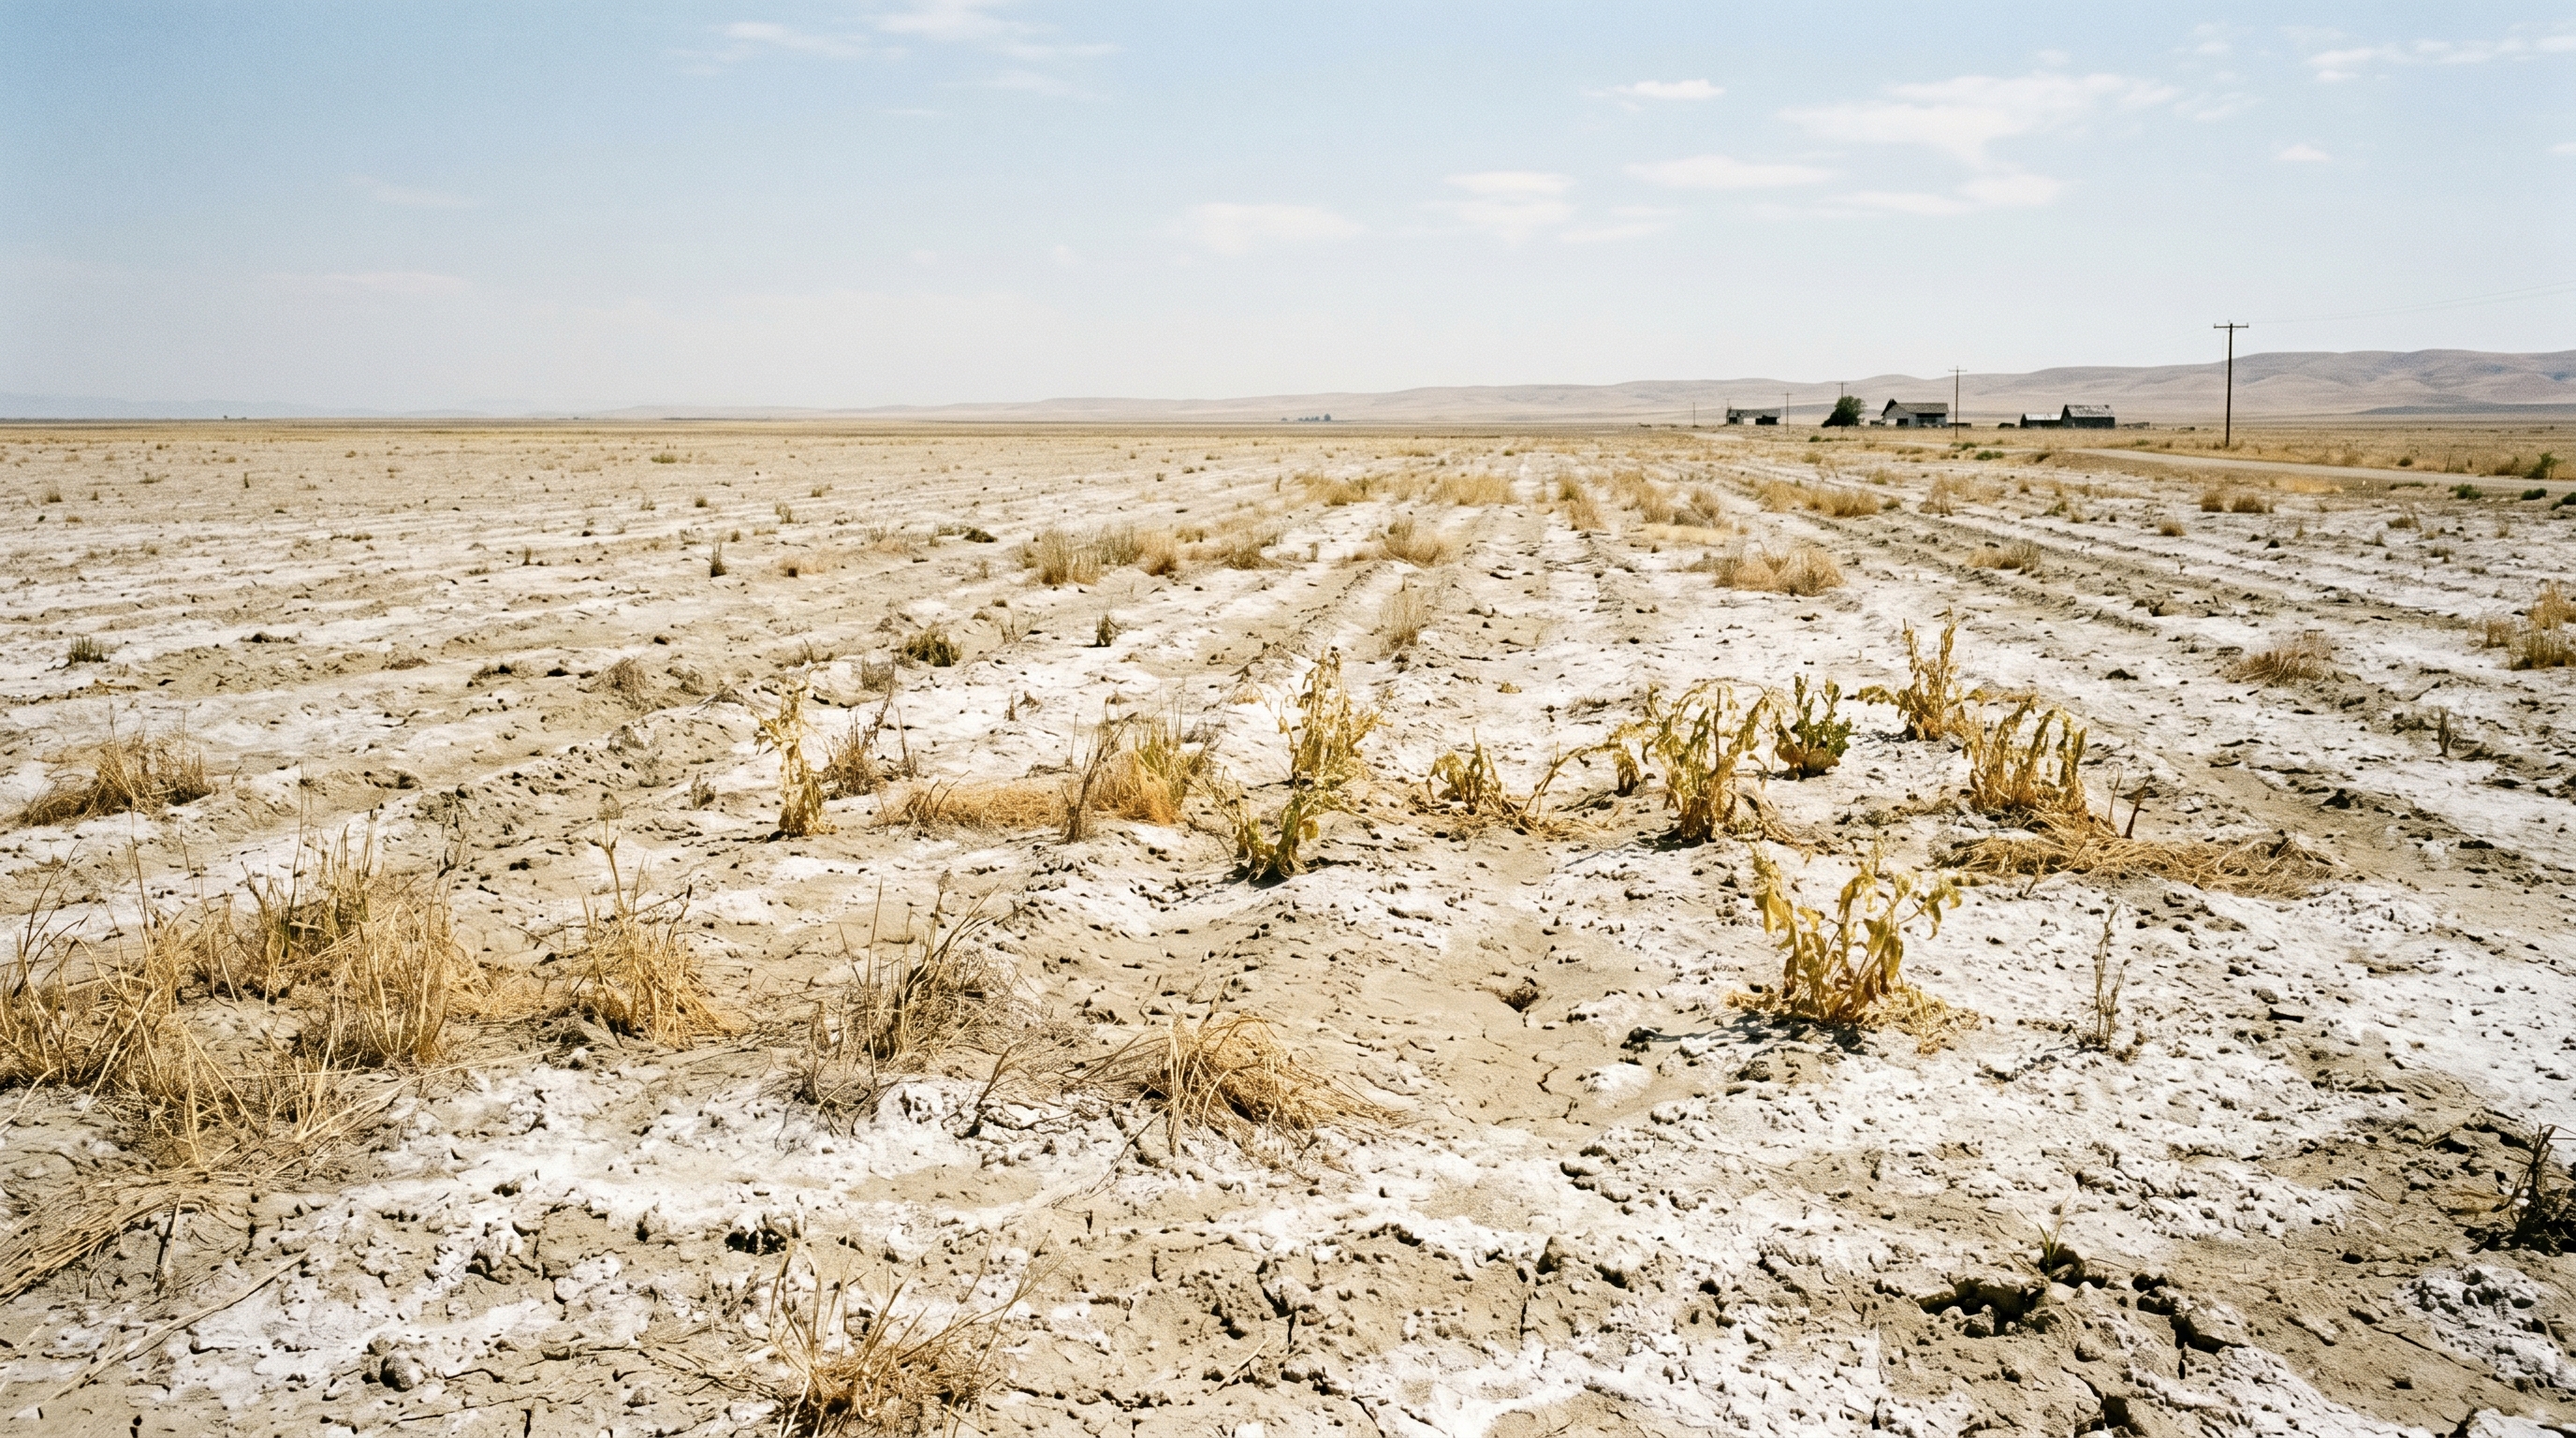
The second pressure is salinization. Irrigation water in arid regions typically carries 0.3 to 2.0 dS/m of dissolved salts. In a soil with low rainfall to flush them, those salts accumulate in the root zone over years to decades. Above approximately 2 dS/m saturation extract conductivity (ECe), microbial respiration is measurably suppressed; above 4 dS/m, the suppression becomes severe and the nitrifying community in particular contracts sharply (Rath & Rousk 2015). Many plant-growth-promoting rhizobacteria and arbuscular mycorrhizal fungi tolerate moderate salinity poorly. Salinity does not just suppress yield directly through osmotic stress on the plant — it suppresses the biology that would otherwise help the plant tolerate the stress.
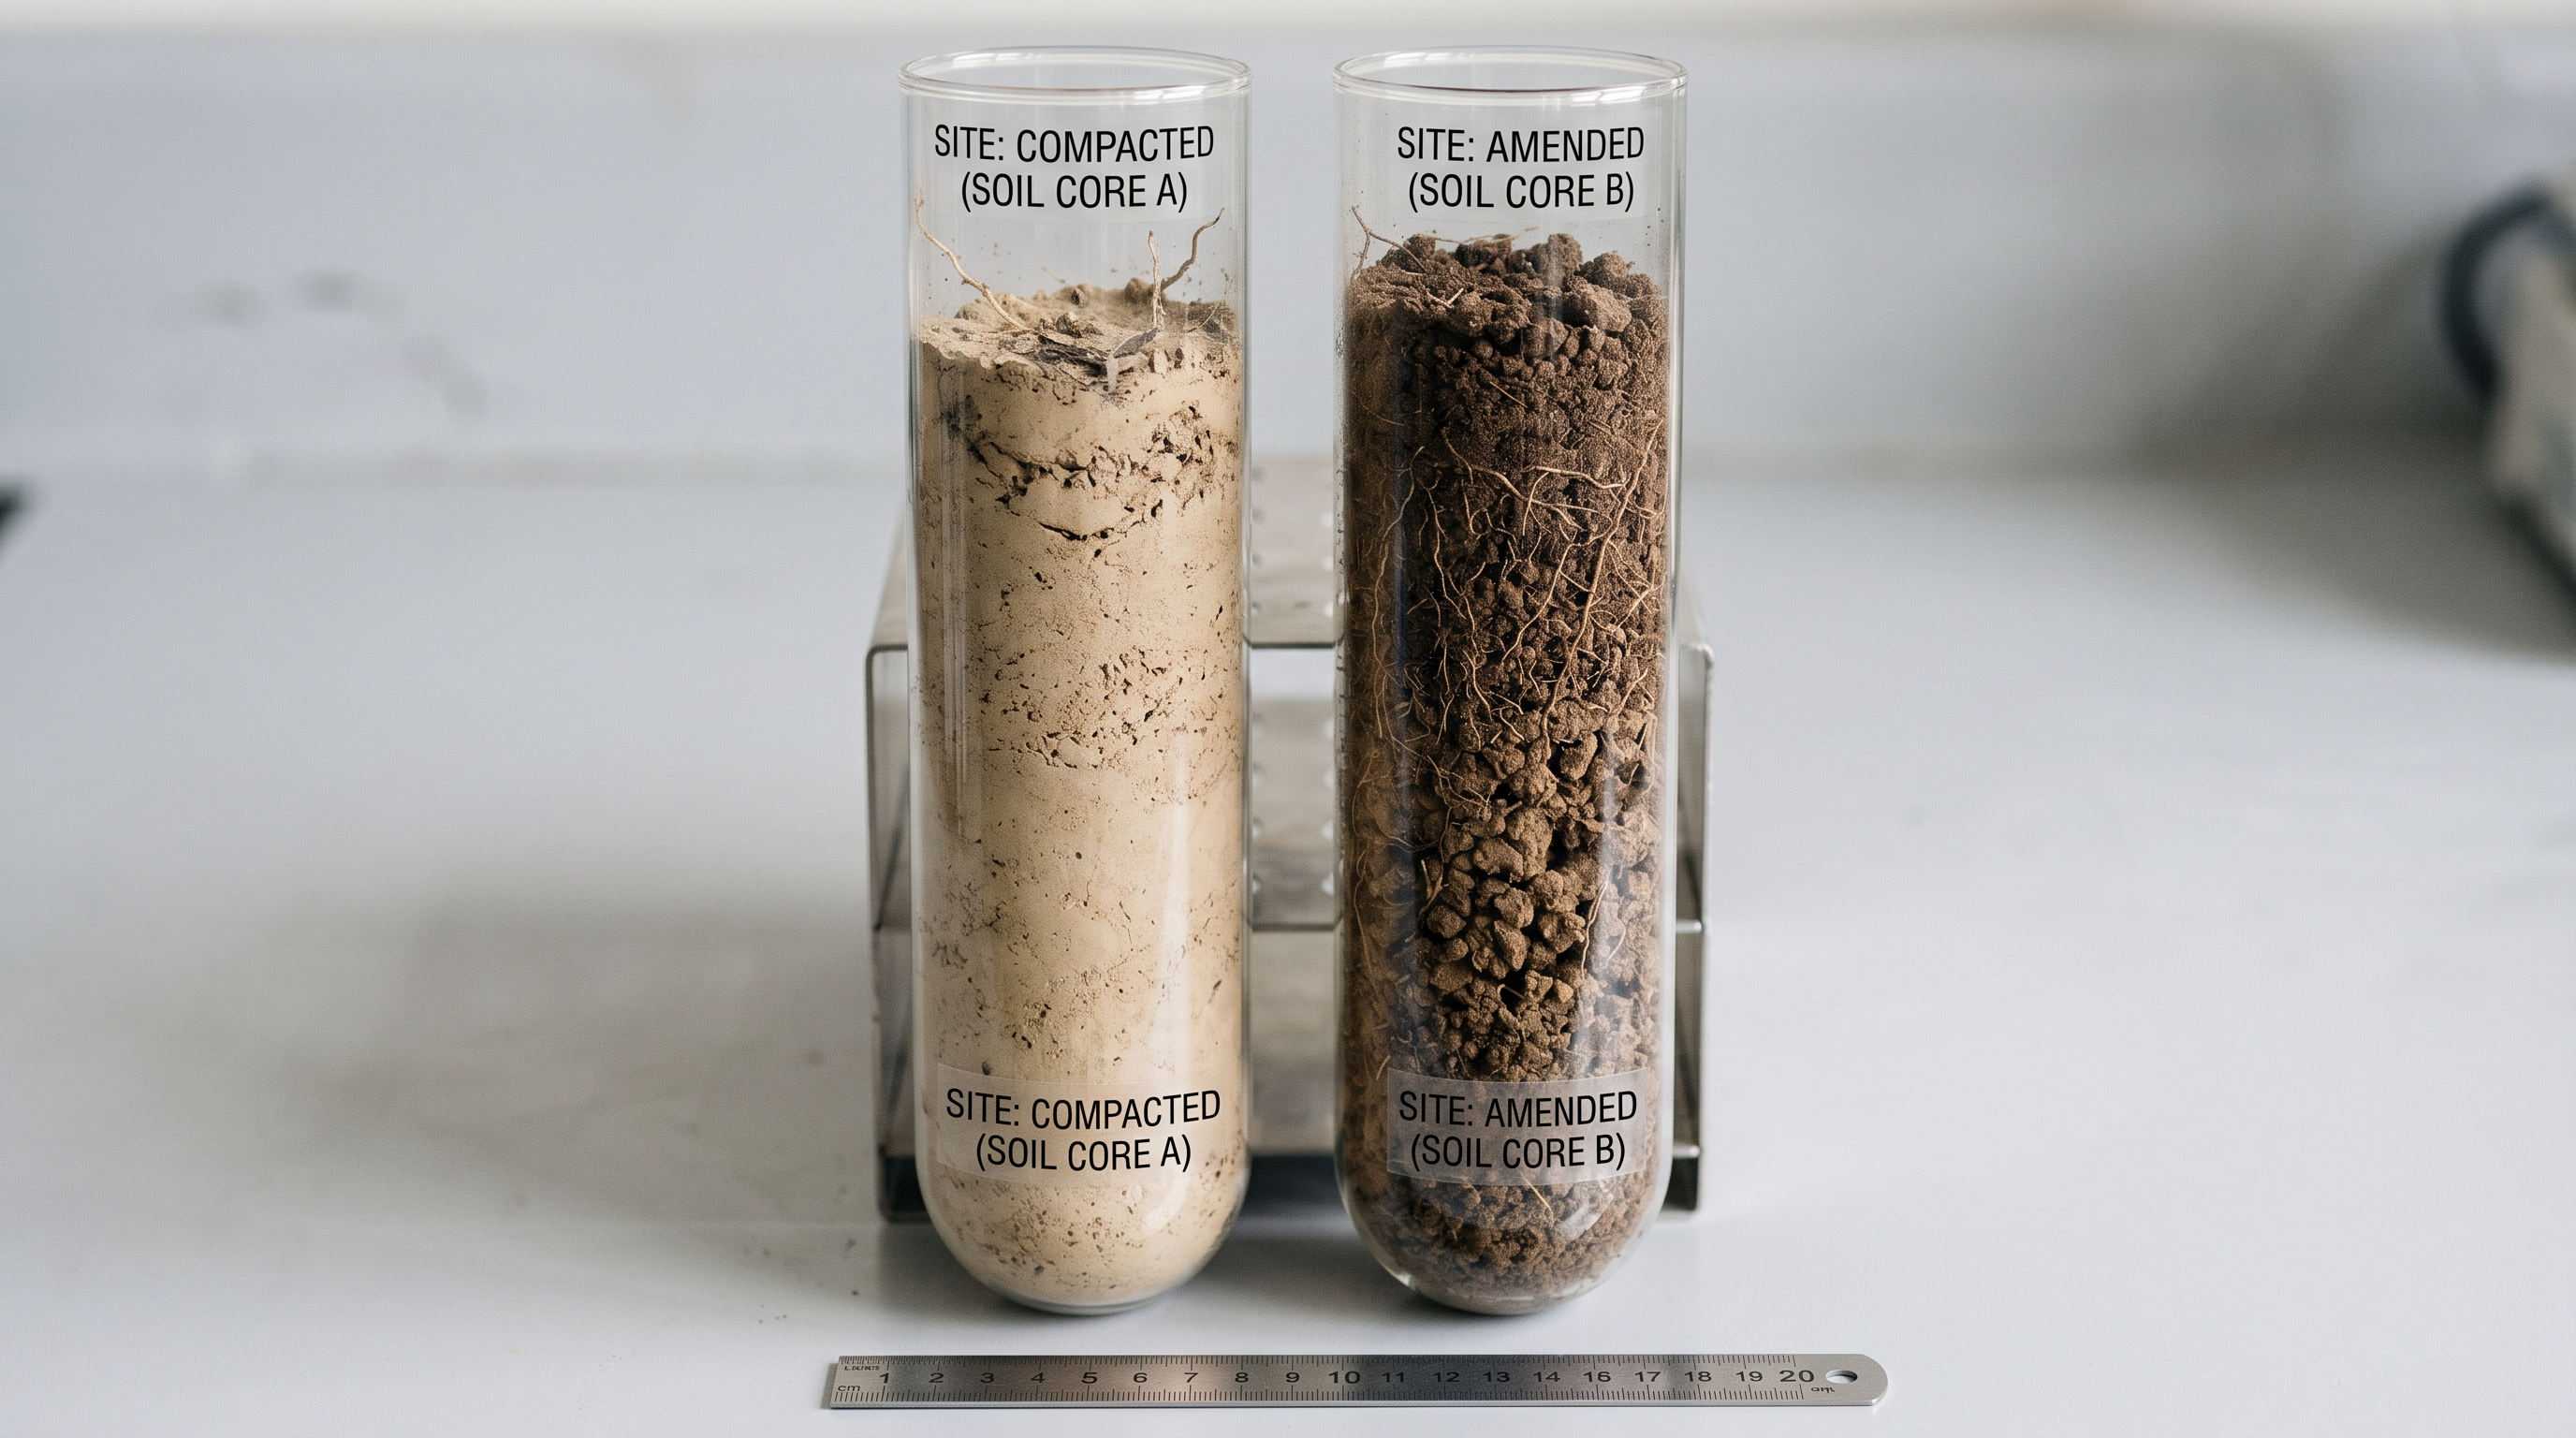
The third pressure is physical degradation. Without a steady supply of microbially-produced binding agents — glomalin from arbuscular mycorrhizae, microbial extracellular polymeric substances, fungal hyphae — soil aggregates weaken (Rillig 2004). Compaction follows. Infiltration rates decline. A surface seal forms after each irrigation. Water that should have penetrated to the root zone runs off, evaporates, or perches in a thin band that supports neither deep rooting nor microbial activity. Volumetric water-holding capacity — a function of pore architecture and organic matter — falls.
The compounding outcome is what farmers describe as "tired" soil: more inputs required for the same yield, more water for the same biomass, and a season eventually arriving in which the yield drops despite full-rate fertilization. The agronomic response cannot be a higher synthetic dose. It must address the missing biology directly. (For a more accessible introduction to this cycle for a non-specialist audience, see What's actually alive in your soil and How a tired field comes back.)
2. Live-microbial inputs versus synthetic NPK — mechanistic differences
The functional gap between synthetic mineral fertilizer and a live-microbial input is often discussed in marketing terms. Set aside the marketing. The mechanistic differences are concrete and measurable, and they matter for designing a field trial.
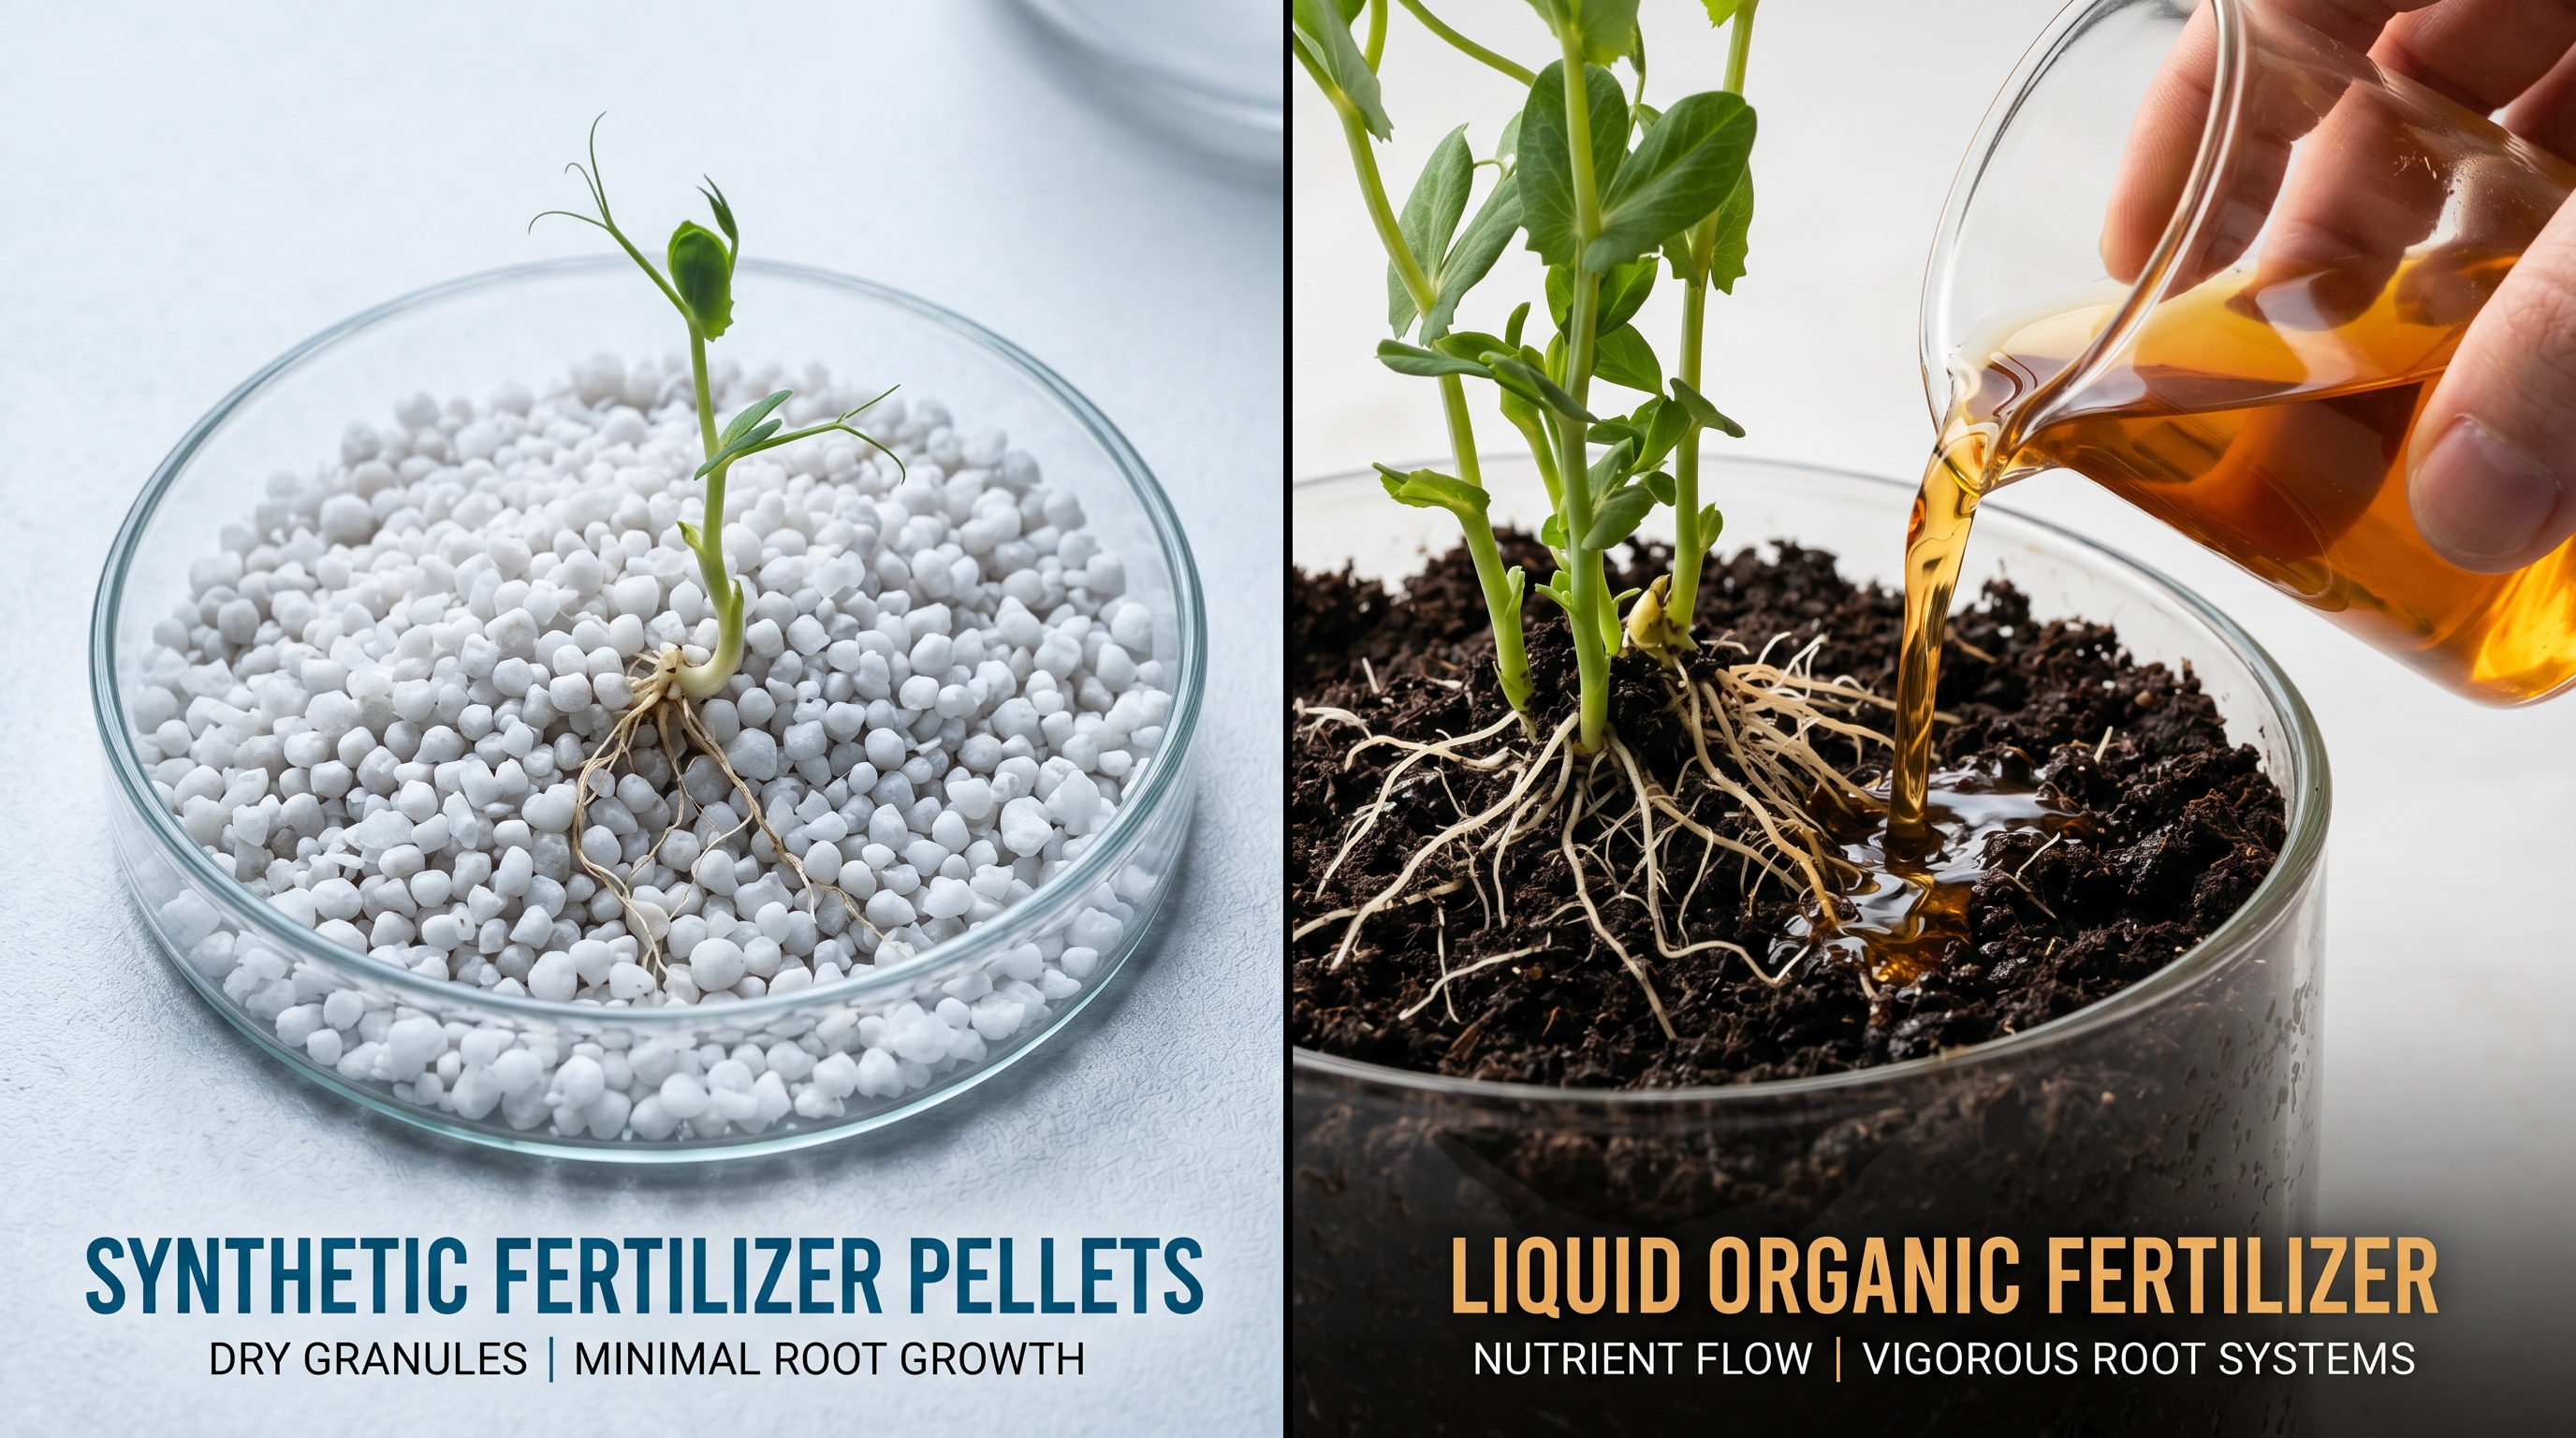
A synthetic NPK product — urea, DAP, MOP, or a soluble blended formulation — delivers a defined mass of plant-available macronutrient ions in a soluble or readily-soluble form. It is fast, predictable, and uniform. It does three things well: corrects an acute deficiency in a single growing season, maximizes short-term shoot biomass response, and integrates cleanly into fertigation systems calibrated by EC and pH. It does not contribute soil organic matter, does not seed or feed microbial communities, and in many formulations has a measurable salinizing effect on the immediate root zone — DAP and ammonium sulfate are particularly notable (Geisseler & Scow 2014). Repeated application without organic amendment is associated with declining MBC, declining SOC, and declining mycorrhizal colonization rates over multi-year horizons (Treseder 2004).
A live-microbial input is a different category of product. The Magic Power fertilizer used in the protocols described in this paper is the liquid biological residue of a closed-loop recirculating aquaculture system. It carries plant-available NPK derived from fish manure — typically in the range commonly observed for liquid fish-manure fertilizers — alongside three additional active fractions: (1) a viable microbial consortium dominated by aerobic heterotrophs and including nitrifiers, ammonifiers, and a range of plant-growth-promoting taxa; (2) microbially-produced metabolites, including organic acids, polysaccharides, siderophores, and phytohormones; and (3) dissolved and suspended organic carbon at concentrations several orders of magnitude above what a soluble synthetic carries.
The mechanistic effects on soil follow from those three fractions. Live microbes introduced at the rhizosphere, given carbon to metabolize, increase the active fraction of the soil microbial community. Aggregate stability rises as glomalin and EPS accumulate (Rillig 2004; Six et al. 2004). Infiltration rates rise as aggregate structure rebuilds. Mineralization of native soil organic matter, both old and new, accelerates — a function not just of microbial mass but of the metabolic activity of that mass (Schimel & Schaeffer 2012). Plant water status under stress improves through a combination of better aggregate-mediated water-holding, mycorrhizal extension of the root absorbing surface, and microbial production of compounds that modulate stomatal behavior and root architecture (Rolli et al. 2015).
It is important to be precise about what live-microbial inputs do not do. They are not a one-shot replacement for plant nutrient management. The NPK fraction in any practical biological liquid is dilute relative to soluble synthetics, and acute deficiencies must still be addressed agronomically. They do not produce visible yield response in season one in every system — meta-analytic evidence suggests positive yield responses in roughly 70 percent of trials, with substantial variance attributable to soil type, baseline biology, and crop (Schütz et al. 2018; Rubin et al. 2017). They do not "guarantee" outcomes in any season. What they do is address the structural deficit — biological, physical, organic — that synthetic-only programs cannot address by design. The trial protocol below is built to measure that contribution honestly.
3. Pre-trial baseline measurement
A trial that does not start from a measured baseline cannot end with measured conclusions. Invest in baseline before you change a single input. The protocol below assumes an arid commercial farm with one to several distinct field blocks, drip or pivot irrigation, and a willingness to designate matched treatment and control blocks for at least twelve months.
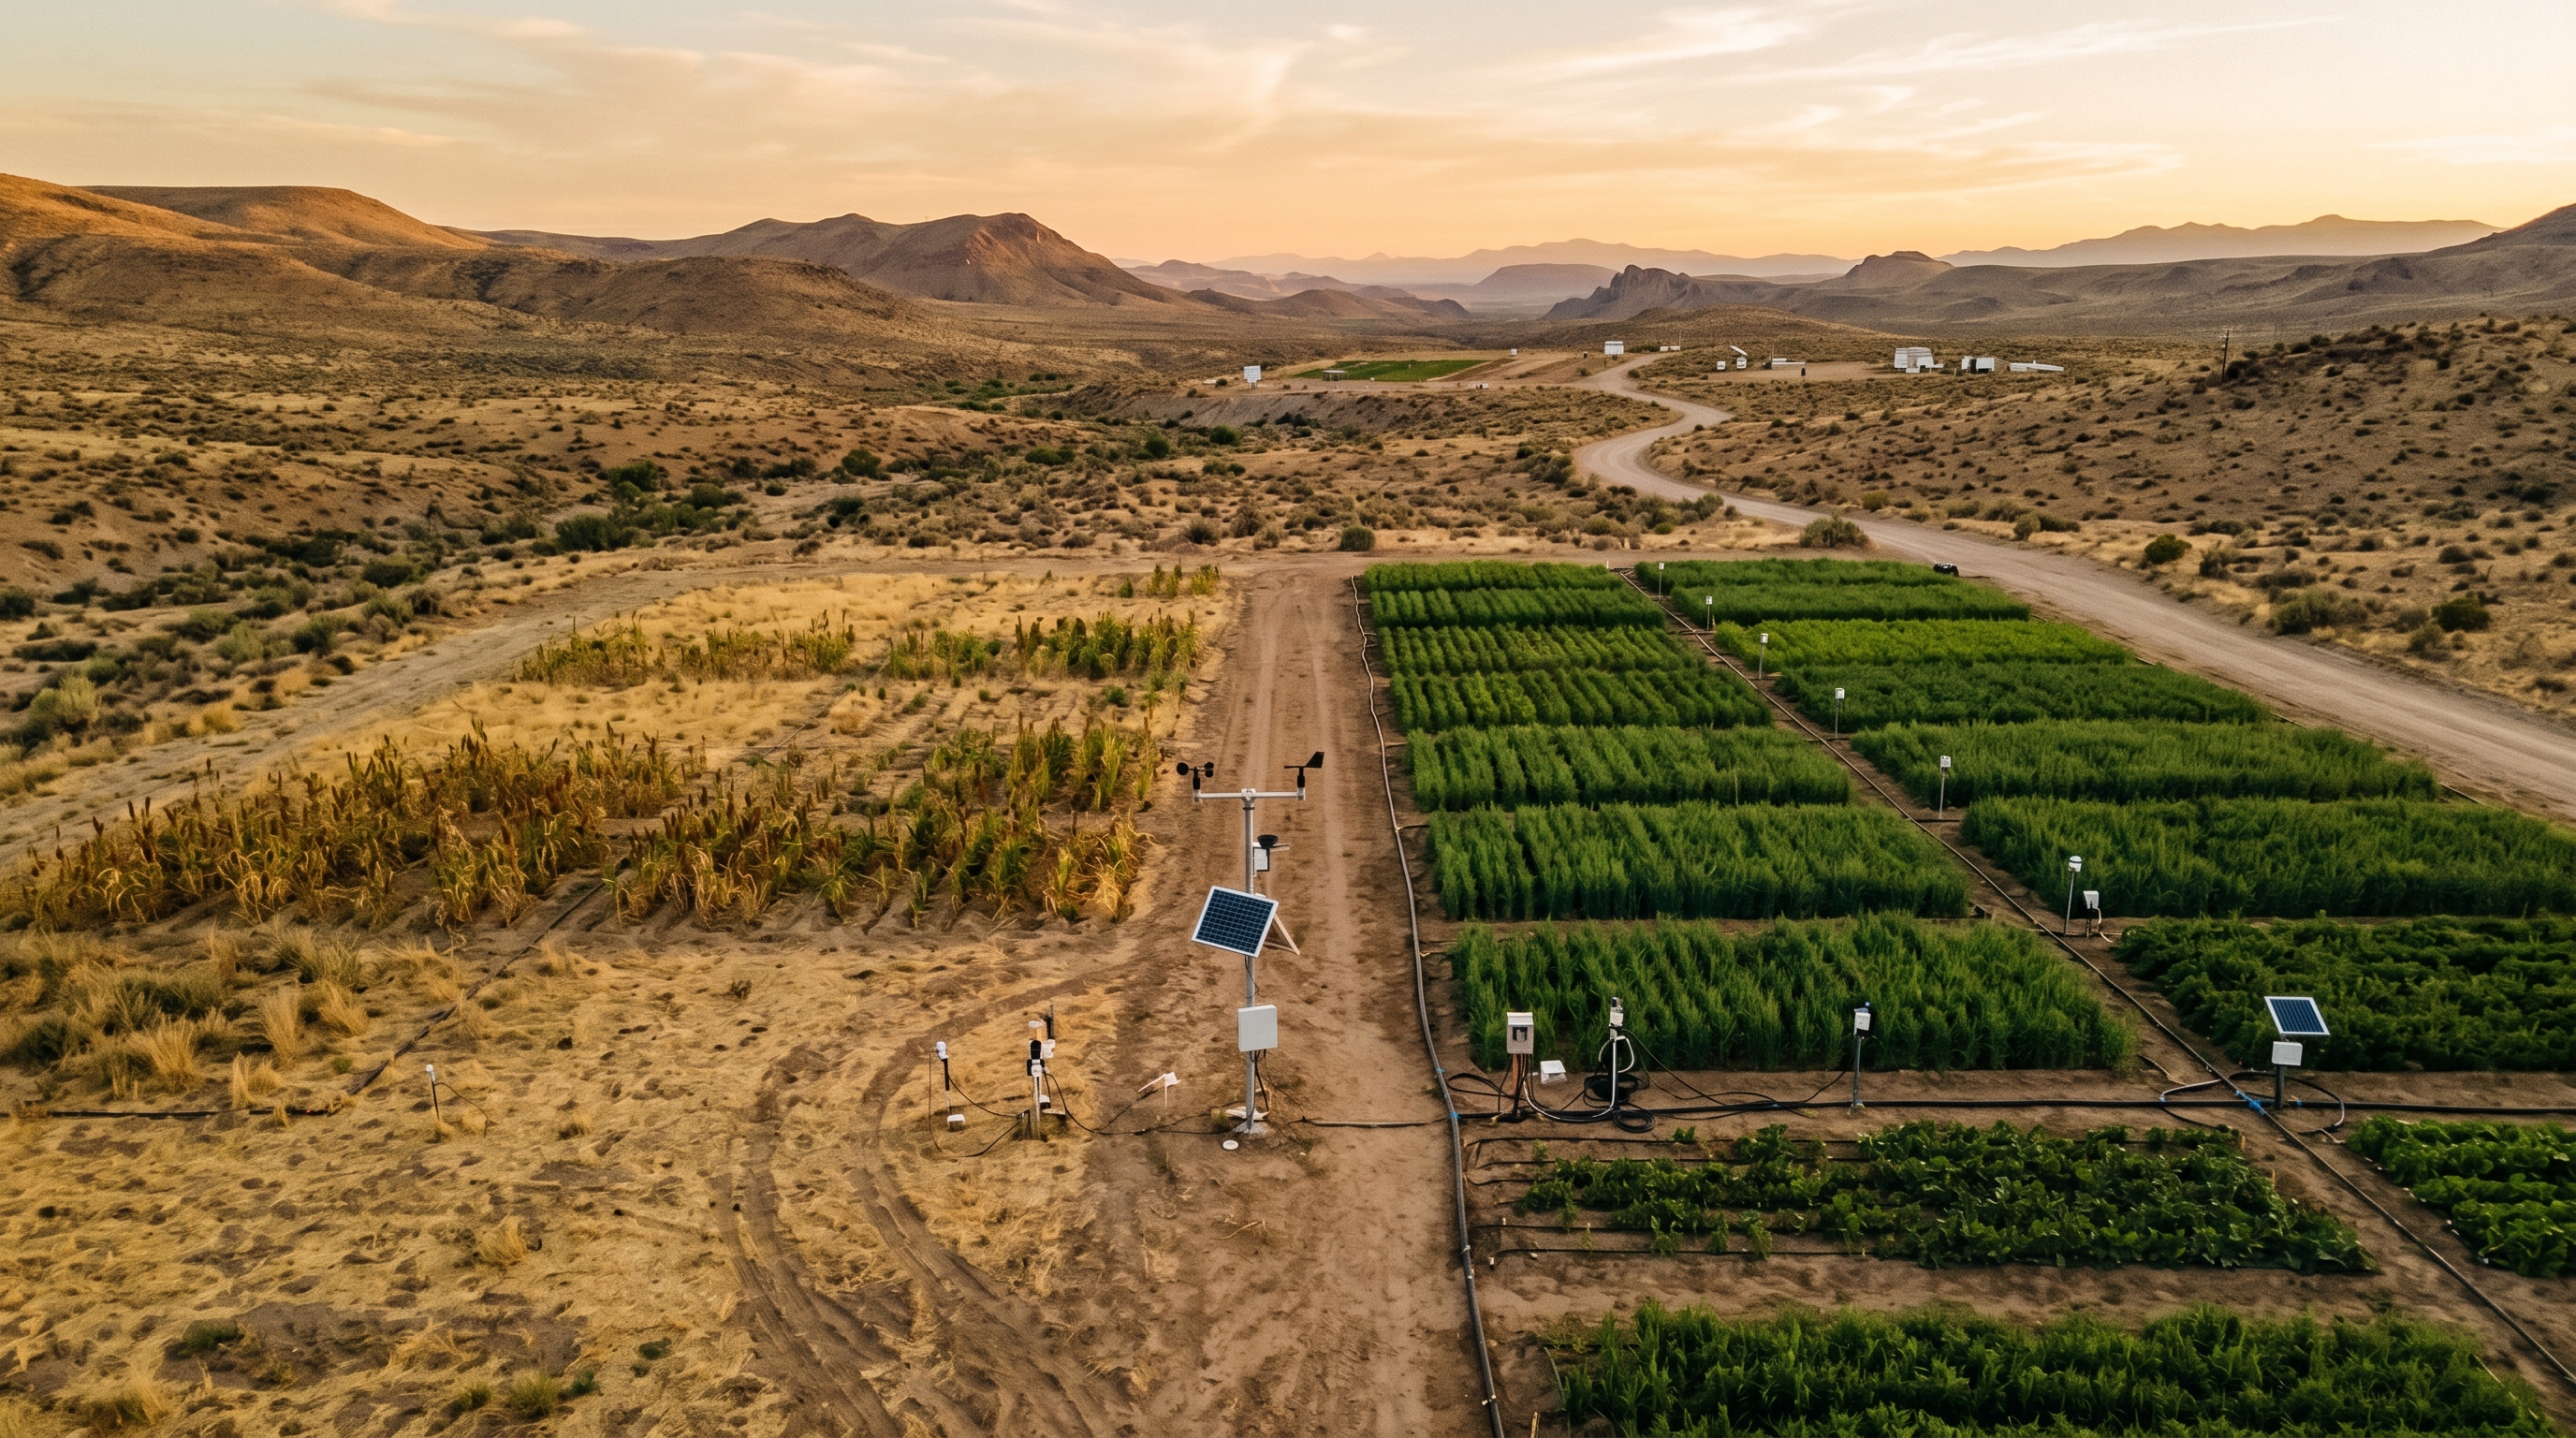
Field design
Designate, at minimum, a paired treatment and control block within a single field that has uniform soil texture, slope, and irrigation infrastructure. For statistical power, prefer four blocks of each — two treatment, two control — with randomized assignment if logistics allow. Block size should be agronomically meaningful: a minimum of 0.5 hectare per block for open-field row crops, 0.1 hectare per block for high-value greenhouse, and one full vineyard or orchard row pair per block for perennial systems. Document GPS coordinates, area, irrigation system specification, and crop rotation history for each block.
Sampling protocol
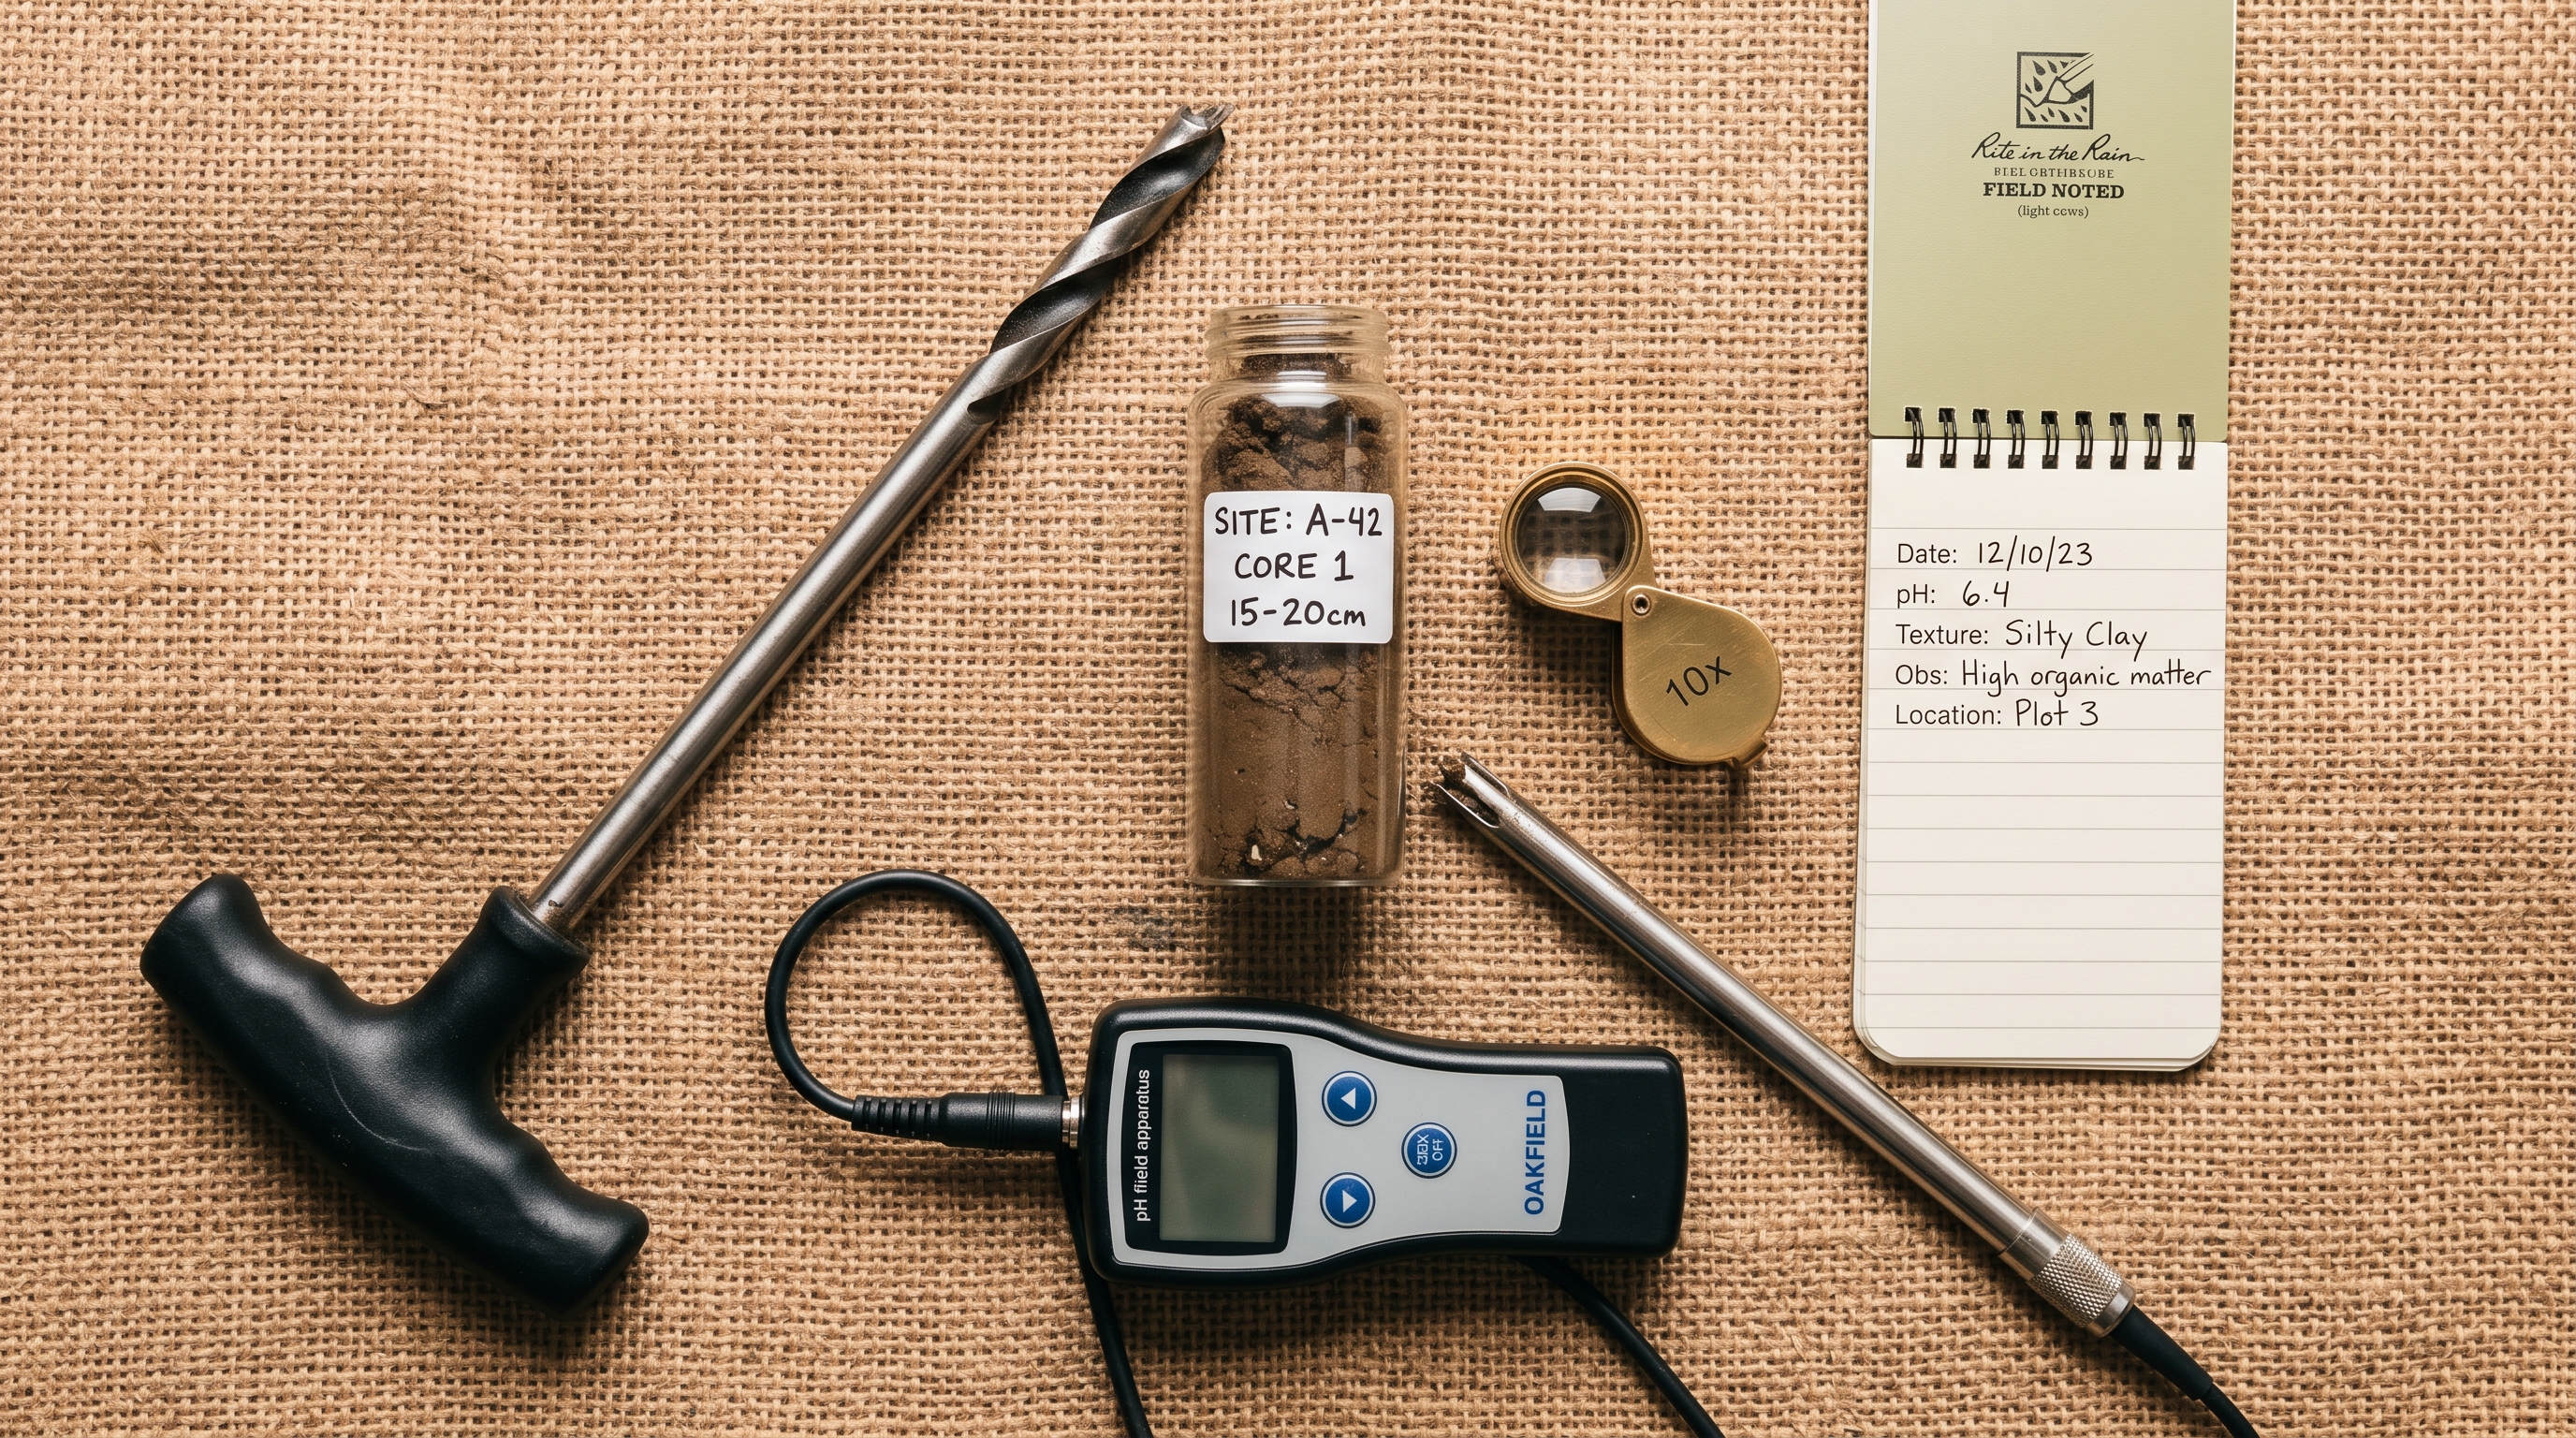
Sample soils between two and four weeks before the trial begins, after the previous crop is removed and before any pre-plant tillage or amendment. Take samples at 0–15 cm and 15–30 cm depth as separate composites. Within each block, collect a minimum of 15 sub-samples on a regular grid or W-pattern, mixed to a single composite per depth per block. Use a clean stainless or chrome-plated soil auger; do not use galvanized tools where micronutrient analysis is required. Place samples in clean polyethylene bags, label clearly with block ID, depth, and date, and ship to a certified soil laboratory within 48 hours. For microbial assays, refrigerate at 4°C and ship cold; do not freeze.
Tests to run on every baseline composite
The minimum baseline panel is:
- Soil organic carbon by Walkley-Black or, preferably, dry combustion (LECO or equivalent). Report as percent C by mass.
- Microbial biomass carbon (MBC) by chloroform-fumigation extraction (Vance et al. 1987). Report in mg C per kg dry soil.
- Basal soil respiration by 24-hour CO2 efflux at 25°C and 60 percent water-holding capacity. Report in mg CO2-C per kg per day.
- Aggregate stability by wet-sieving to determine mean weight diameter (MWD) of water-stable aggregates, or by the slake test as a field-friendly proxy.
- Infiltration rate in the field by single-ring or double-ring infiltrometer (15 cm minimum diameter) at three points per block, expressed in mm/hour at quasi-steady state.
- Volumetric water-holding capacity at -33 kPa (field capacity) and -1500 kPa (permanent wilting point) by pressure plate, on undisturbed cores where possible. The difference is plant-available water.
- Electrical conductivity (ECe) of the saturated paste extract, in dS/m.
- pH of the saturated paste, with a calibrated meter.
- Available macro and micro nutrients by the analyte panel standard for your region (typically Olsen-P or Mehlich-3, exchangeable K, exchangeable Mg and Ca, DTPA-extractable Fe/Mn/Zn/Cu, and total or available N).
Equipment list
A minimum-viable baseline kit includes: a stainless soil auger (Edelman or Dutch type), a 15-cm single-ring infiltrometer (a section of welded steel pipe is acceptable for field use), a calibrated pH/EC meter, a digital soil thermometer, a laboratory-grade scale (1 mg resolution) if you are running any in-house analysis, sample bags and a permanent marker, and a cooler. For lab-dispatched samples, no further equipment is needed beyond what the contracted laboratory specifies.
Yield and input baseline
Independently of soil chemistry, document the previous three to five years of yield (per hectare or per crop unit), fertilizer input by type and rate, irrigation volume, and where available, water-use efficiency (kg of marketable yield per cubic meter of irrigation). This is the agronomic baseline against which the trial's treatment effect will eventually be assessed. Do not skip this step. Soil tests without yield context generate confusion, not insight.
4. Application protocol
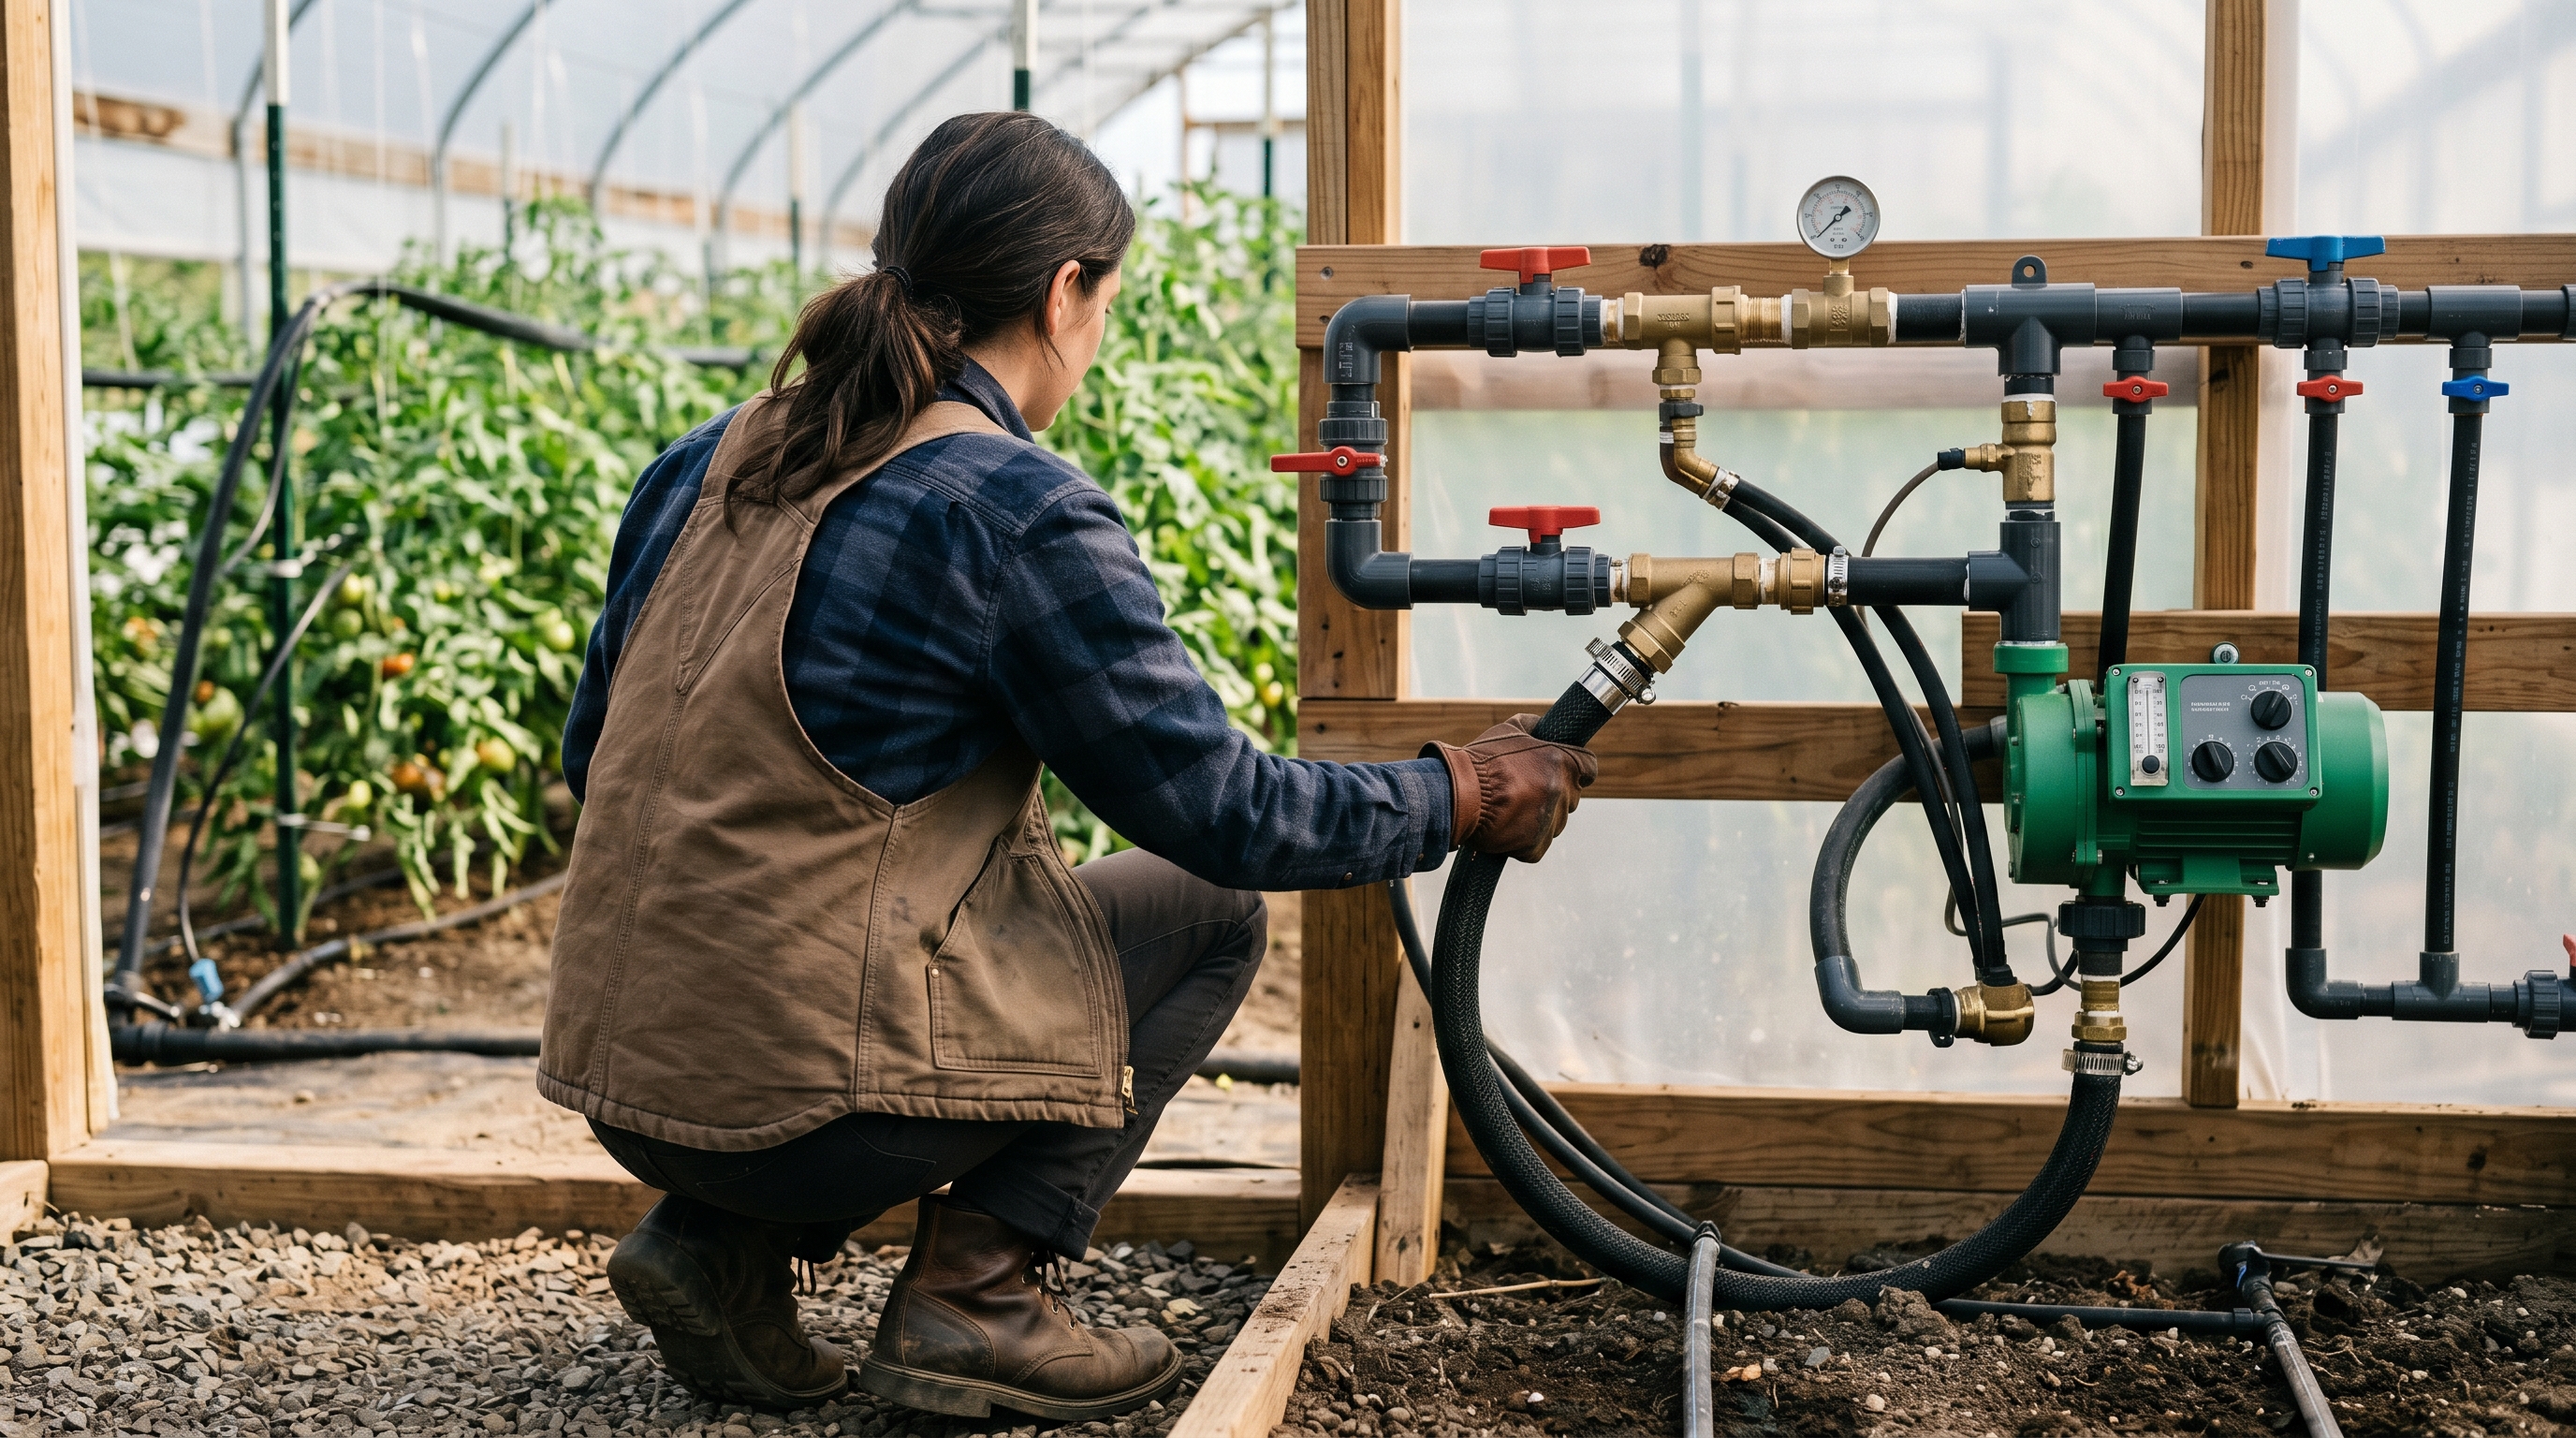
The application protocol is intentionally simple. The Magic Power live-microbial input is delivered through the existing irrigation system as a fertigation event. The biology is the value; the dosing is straightforward.
Dilution
The standard dilution is 1 L of Magic Power concentrate per 1,000 L of irrigation water. This dilution preserves microbial viability through the dosing line, avoids osmotic shock at the emitter, and delivers a meaningful inoculum density to the rhizosphere. Concentrate-to-water ratios outside the range of 1:500 to 1:2000 are not recommended without consultation. Higher concentrations do not produce proportionally larger benefits in any documented trial; lower concentrations may fail to deliver an effective inoculum dose.
Irrigation system requirements
The protocol is compatible with standard drip, micro-sprinkler, and pivot fertigation systems. Three constraints must be respected.
First, the dosing pump must deliver the concentrate at a stable ratio — a Venturi injector, Dosatron, or proportional injection pump rated for biological products. Avoid metering pumps with internal materials known to react with biological liquids; stainless or PVC-wetted parts are preferred.
Second, chlorinated source water is incompatible with live-microbial inoculation. Free chlorine above 0.5 ppm at the emitter will measurably reduce viable microbial counts in the dosed water. Where municipal chlorinated water is the only available source, install a granular activated carbon dechlorinator upstream of the injection point, or hold the water in an open reservoir for 24 hours to allow free chlorine to dissipate before fertigation. Chloraminated water requires ascorbic acid dosing or a dedicated chloramine filter; neither holding nor activated carbon alone is sufficient.
Third, the fertigation event should be timed to deliver the dosed water to the root zone with the irrigation cycle, not flushed past it. Inject during the middle two-thirds of the irrigation event so that the biological reaches the wetted zone but is followed by sufficient clean water to clear the lines. End every fertigation event with a five to ten minute clean-water flush.
Application timing
For annual crops, apply at three milestones per cycle:
- Pre-plant or vegetative establishment — within seven days of seeding or transplanting. This colonization event seeds the rhizosphere as roots emerge.
- Mid-season vegetative-to-reproductive transition — once at peak vegetative growth and again at flowering or fruit-set, depending on crop length.
- Post-harvest — within two weeks of harvest, before residue is incorporated. This builds biology into the residue decomposition phase.
For perennial crops (vines, stone fruit, citrus, olives), apply four to six times per growing season — at bud break, pre-flowering, post-fruit-set, mid-summer, post-harvest, and pre-dormancy. In greenhouse production with year-round cropping, apply on a four-to-six-week cycle continuously.
Volumes per hectare
At 1:1000 dilution, the per-hectare concentrate requirement varies with the irrigation event volume. For a typical drip-irrigated open-field horticultural crop receiving 30,000 L per hectare per fertigation event, the dose is 30 L of concentrate per hectare per event. For a high-volume pivot event of 100,000 L per hectare, the dose is 100 L per hectare per event. For greenhouse drip operating at 10,000 to 15,000 L per hectare per event, the dose is 10 to 15 L per hectare. Annualized, a typical open-field horticultural farm in arid conditions consumes roughly 200 to 300 L of concentrate per hectare per year across all events; a vineyard, 100 to 200 L; a greenhouse operation, 300 to 500 L.
Concentrate is supplied in 30 L bag-in-box format for smaller farms and 220 L drums for large farms and cooperatives. Storage stable at ambient temperature in a shaded, ventilated location for up to nine months from production date; do not freeze, do not store in direct sunlight, and once opened, keep closed between uses to maintain microbial viability.
5. Mid-trial measurement
The trial is structured around three measurement checkpoints — three months, six months, and twelve months from the first application — plus an end-of-season agronomic summary. Each checkpoint has a defined panel; together they trace the typical biological-then-physical-then-agronomic trajectory of soil response.
Three-month checkpoint
At three months, the response is biological, not yet visible at the plant. Expect MBC and basal respiration to be the leading indicators. Re-sample at the same depths and locations as the baseline, taking a fresh composite per block. Run the following panel at the laboratory:
- Microbial biomass carbon — typically the first metric to move, with treatment blocks showing 15 to 40 percent increases over baseline in trials documented in arid systems where baseline MBC was below 200 mg C/kg.
- Basal respiration — usually rises in proportion with MBC, though the metabolic quotient (qCO2, the ratio of respiration to biomass) often falls slightly, indicating a more efficient community.
- A simple slake test in the field — usually shows visible early aggregate-stability improvement.
Do not expect SOC to have moved at three months. Bulk soil organic carbon is a slow-response variable and a three-month change is rarely above the detection threshold of standard methods. Do not expect infiltration rate to have changed materially. Do not expect yield response in this window for most crops.
Six-month checkpoint
By six months, the physical metrics begin to respond. Re-run the three-month biological panel, and add:
- Aggregate stability by wet-sieving — meaningful increases in MWD typically appear here, often in the range of 10 to 25 percent above baseline.
- Infiltration rate at three points per block — usually shows measurable improvement in this window, though variance is high.
- Soil EC — should be stable or slightly declining as biology mediates salt mobility and improved infiltration enables some leaching. Do not expect dramatic change.
For annual crops, the six-month checkpoint typically falls within or after one harvest cycle, and yield response should be assessed at this point. Document yield, marketable fraction, and any qualitative observations on disease pressure, root mass, and crop uniformity.
Twelve-month checkpoint
At twelve months, run the full baseline panel a second time. The expected response profile in target crops, pre/post measured in trials with adequate baseline biology and an irrigation system within the specifications above, includes:
- MBC sustained at 25 to 60 percent above baseline.
- Basal respiration sustained, with a stable or improved qCO2.
- SOC measurably higher in the 0–15 cm layer — typically 0.05 to 0.20 percentage points absolute, which is meaningful at arid-region baselines of 0.5 to 1.0 percent.
- Aggregate stability MWD up 20 to 40 percent above baseline.
- Infiltration rate up 30 to 80 percent above baseline.
- Volumetric water-holding capacity at field capacity up 5 to 15 percent absolute.
- ECe stable or trending down where good leaching fraction was maintained.
- Yield response — typically positive in 65 to 75 percent of comparable trials, with mean yield gains of 8 to 18 percent reported in arid-system meta-analytic data on biological inputs (Schütz et al. 2018), with substantial variance.
Reporting
At each checkpoint, file a written report comparing each treatment block against the matched control. Use absolute and percentage change. Include photographs of the slake test, soil cores, and crop. Track water input volume per block carefully. Anecdote without measurement is noise; measurement without context is too. The report does both.
6. Result interpretation
A field trial is not a meta-analysis. Variance at the individual-farm level is substantial, and a single block's behavior should be read against the underlying ecology rather than against an idealized curve. Three frames help interpretation.
What good looks like
The strongest signal of a successful trial is internal consistency across metrics. MBC, basal respiration, aggregate stability, and infiltration tend to move together. SOC and water-holding capacity move more slowly but trend in the same direction over twelve months. Yield response is the noisiest metric in season one and should not be the sole basis of any conclusion. If five biological and physical metrics all rise modestly and yield is statistically indistinguishable from control, the trial is going well — soil rebuild precedes plant response, often by a season.
Typical season-one through season-three trajectory
Season one is usually the smallest agronomic effect and the largest biological-foundation effect. The microbial community rebuilds, aggregates begin to form, infiltration rises, and the plant gets a modest direct nutrient contribution. Yield in season one in arid systems with low baseline biology is often within +/-10 percent of control, with high variance. Season two typically shows the clearest agronomic effect — yields gain 10 to 25 percent over control in good-fit systems, water-use efficiency rises, and disease pressure on roots is often visibly reduced. Season three is when soil-level metrics consolidate: SOC plateaus at the new equilibrium for the input rate, aggregate structure stabilizes, and the farm's dependence on synthetic N typically falls 30 to 60 percent without yield penalty.
This trajectory is not guaranteed, and the bands above are representative ranges from agronomic literature on biological inputs (Schütz et al. 2018; Rubin et al. 2017; FAO 2015), not promises. A farm with very low baseline biology may take longer to respond. A farm with already-healthy biology may show smaller relative gains because there is less to recover.
When to adjust the protocol
If at six months no measurable biological response is observed, examine four possible causes in order: (1) source-water chlorine or chloramine residual at the emitter; (2) dilution error at the dosing pump; (3) salinity above 4 dS/m masking the response; (4) extreme baseline carbon depletion requiring a supplemental organic amendment in addition to the live-microbial input. Adjust the most likely cause first and re-measure at the next checkpoint.
If at twelve months the biology has moved but yield has not, the limiting factor is most likely outside the soil-microbiome envelope — water deficit, mineral macronutrient deficiency, salinity, variety choice, or pest pressure. Escalate the agronomic diagnosis. The protocol is designed to address one part of a system; it does not replace the rest of agronomy.
A final interpretive note: when reading replicate-to-replicate variance, look at the central tendency, not the extremes. A treatment block that responds 40 percent above control while a paired block responds 5 percent above control is not a failed trial — it is a working trial with an unidentified confounder in the second block. Investigate spatial heterogeneity, irrigation uniformity, and historical management before discounting the result. Soil is famously heterogeneous at the meter scale; replication exists precisely to make sense of that.
For a more accessible field-side description of the recovery curve, see How a tired field comes back.
7. Common pitfalls
Five recurring failure modes account for most disappointing trials. Each is avoidable.
Over-correction with synthetic in season one
The most common pitfall is the urge to "rescue" a treatment block in season one when yields run a little behind expectation. Adding back synthetic N — particularly urea or ammonium sulfate at high rates — both inflates the salinity load on the rebuilding biology and confounds the trial. A treatment block that received both Magic Power and a panic dose of urea is no longer a clean treatment block. Hold the protocol. The whole point of the trial is to learn the season-one trajectory honestly.
Wrong dilution
The 1:1000 ratio assumes the concentrate is undisturbed, fully mixed, and dosed proportionally. Two failures recur. The first is using a fixed-rate metering pump on a variable irrigation flow, which produces undosed and over-dosed segments through a single event. Use proportional Venturi or Dosatron-style injection. The second is mixing the concentrate with stock fertilizer tanks of high-EC soluble synthetic — the salinity shock kills a large fraction of the microbial population before it reaches the field. Inject the live-microbial separately, with its own injection point, downstream of any soluble-fertilizer injection.
Anaerobic storage
Magic Power is an aerobic biological liquid. Sealed anaerobic storage at high temperatures shifts the microbial community toward fermentative anaerobes within a few weeks, producing off-odors, gas pressure in the container, and a measurably reduced agronomic effect on application. Store in shade, vent the container slightly between uses, and respect the storage life on the label. If a container is forgotten in a warehouse for a year, do not use it; obtain a fresh batch.
Freeze damage
Freezing destroys a substantial fraction of the viable microbial population through ice-crystal lysis. In trial sites with sub-zero winter exposure — the Czech Republic vineyard case below being the obvious example — store concentrate in a temperature-controlled facility through winter. Outdoor unheated storage is acceptable in subtropical and tropical sites but not in continental temperate ones.
Incompatible chlorinated water source
Recurring municipal-water trials in the GCC have produced flat results that, on investigation, traced to free-chlorine residuals of 0.7 to 1.4 ppm at the emitter — well above the 0.5 ppm tolerance threshold for live-microbial dosing. Test source water for free and combined chlorine before starting the trial. If chlorine is present, install activated-carbon dechlorination ahead of the injection point. Do not assume well water is chlorine-free; some farms in the wider region top up well storage with chlorinated municipal water during dry months without formal documentation.
A more accessible discussion of why infiltration and water-quality matter so much in arid trials is in Water that stays where you put it.
8. Case studies
The three case studies below describe representative trials in distinct climates, soils, and crops. Numbers are reported in ranges rather than single-point estimates to reflect honest agronomic variance, and farm-level identifiers have been anonymized to respect commercial confidentiality.
Case study A — UAE arid greenhouse, mixed leafy greens
A 2.4-hectare protected-cropping facility outside Al Ain, growing rotations of lettuce, basil, and Asian leafy greens on a year-round eight-week cycle, in a soilless drip-fertigated medium of coco coir over a sandy loam pad. Baseline conditions: medium MBC very low for any biological assay (the coir matrix is effectively microbially-inert at planting), pad SOC 0.6 percent, infiltration limited by the impermeable plastic sheet, source water from desalinated municipal supply at 0.4 dS/m.
Protocol: Magic Power injected at 1:1000 through the existing fertigation system on every irrigation event for the first four weeks of each crop cycle, then twice weekly for the remainder. Eight months of observation across four crop cycles per house, on two treatment houses and two matched control houses.
Outcomes (range across the two treatment houses, paired against controls): MBC in the coir matrix climbed from baseline-zero to an active biological community by week four of cycle one. Marketable yield rose 10 to 16 percent over control across the four cycles, with the largest gains in the third and fourth cycles. Disease pressure (predominantly Pythium-mediated root rot, the chronic loss in the operation) declined visibly; loss-from-disease per cycle fell from a multi-month average of 6 to 9 percent of crop to 2 to 4 percent. Water use per kilogram of marketable yield fell roughly 12 to 18 percent, almost entirely through reduced disease loss rather than reduced applied irrigation. Synthetic N input was reduced by 25 percent in the second four-month period without yield penalty.
Case study B — South Africa open-field stone fruit, Western Cape
A 38-hectare nectarine and peach orchard near Robertson on a sandy clay loam, drip-irrigated from a farm dam, on an established Mediterranean-climate program with characteristic low rainfall in the growing season. Baseline conditions: SOC 1.1 percent in the upper 30 cm, MBC moderate, aggregate stability MWD low for the soil's clay content, infiltration capped by surface compaction in tractor wheel-tracks, ECe 1.3 dS/m and trending up.
Protocol: four 12-row blocks treated, four matched control blocks, with Magic Power at 1:1000 applied through the drip on five occasions through the season — bud break, pre-flowering, post-fruit-set, mid-summer, and post-harvest — at approximately 60 L of concentrate per hectare per event. Baseline measurement two weeks pre-bud-break, mid-trial at six months, full re-measurement at twelve months.
Outcomes (ranges across the four treatment blocks against the four control blocks, season one): MBC up 20 to 35 percent at twelve months. Aggregate stability MWD up 15 to 28 percent. Infiltration rate up 35 to 60 percent in the wheel-track zones. SOC up 0.08 to 0.15 percentage points in the 0–15 cm layer. Marketable yield in season one within +/-8 percent of control across the four blocks (one block up 12 percent, three blocks within +/-5 percent), as expected for season one. Season two trended up; season-three results are pending.
Case study C — Czech Republic vineyard, Moravian wine region
A 16-hectare premium Pinot Noir and Riesling vineyard on calcareous loam in a continental climate with wet springs, dry late summers, and freezing winters. Baseline conditions: SOC moderate at 1.6 percent — higher than the arid case studies, reflecting the cooler climate — but MBC depressed under a long history of synthetic-only fertility and herbicide-managed inter-row, and aggregate stability low for the SOC level, indicating biological underutilization of the available carbon.
Protocol: six 0.4-hectare blocks treated, six matched control blocks. Magic Power at 1:1000 applied through the drip on four occasions per growing season — bud break, pre-flowering, mid-summer post-veraison, and post-harvest — at approximately 40 L per hectare per event. Concentrate stored in a temperature-controlled facility through the winter to avoid freeze damage. First season completed; second season under way at the time of writing.
Outcomes (season one, ranges across the six treatment blocks): MBC up 30 to 55 percent at twelve months — the largest relative move of the three case studies, reflecting the high-carbon but biologically underutilized starting condition. Aggregate stability MWD up 25 to 40 percent. Infiltration improvements modest but measurable, in the 15 to 30 percent range. Yield in season one is not the right metric for a perennial, but cluster weights and fruit quality (Brix, total acidity, anthocyanin in the Pinot Noir) were within or slightly above the multi-year farm average. Visual root mass on excavated test vines was clearly higher in treated blocks. Estate has committed to continuing the trial through a full three-season cycle.
In none of the three cases was the biology a stand-alone substitute for the rest of agronomic management. It was a complement that addressed a part of the system that synthetic-only programs cannot address by design.
9. References
Bardgett, R. D., & van der Putten, W. H. (2014). Belowground biodiversity and ecosystem functioning. Nature, 515, 505–511. https://doi.org/10.1038/nature13855
Fierer, N. (2017). Embracing the unknown: disentangling the complexities of the soil microbiome. Nature Reviews Microbiology, 15(10), 579–590. https://doi.org/10.1038/nrmicro.2017.87
FAO and ITPS. (2015). Status of the World's Soil Resources (SWSR) — Main Report. Food and Agriculture Organization of the United Nations and Intergovernmental Technical Panel on Soils, Rome.
Geisseler, D., & Scow, K. M. (2014). Long-term effects of mineral fertilizers on soil microorganisms — A review. Soil Biology and Biochemistry, 75, 54–63. https://doi.org/10.1016/j.soilbio.2014.03.023
Lal, R. (2004). Soil carbon sequestration impacts on global climate change and food security. Science, 304(5677), 1623–1627. https://doi.org/10.1126/science.1097396
Lehmann, J., & Kleber, M. (2015). The contentious nature of soil organic matter. Nature, 528, 60–68. https://doi.org/10.1038/nature16069
Plaza, C., Zaccone, C., Sawicka, K., Méndez, A. M., Tarquis, A., Gascó, G., Heuvelink, G. B. M., Schuur, E. A. G., & Maestre, F. T. (2018). Soil resources and element stocks in drylands to face global issues. Scientific Reports, 8, 13788. https://doi.org/10.1038/s41598-018-32229-0
Rath, K. M., & Rousk, J. (2015). Salt effects on the soil microbial decomposer community and their role in organic carbon cycling: A review. Soil Biology and Biochemistry, 81, 108–123. https://doi.org/10.1016/j.soilbio.2014.11.001
Rillig, M. C. (2004). Arbuscular mycorrhizae, glomalin, and soil aggregation. Canadian Journal of Soil Science, 84(4), 355–363. https://doi.org/10.4141/S04-003
Rolli, E., Marasco, R., Vigani, G., Ettoumi, B., Mapelli, F., Deangelis, M. L., Gandolfi, C., Casati, E., Previtali, F., Gerbino, R., Pierotti Cei, F., Borin, S., Sorlini, C., Zocchi, G., & Daffonchio, D. (2015). Improved plant resistance to drought is promoted by the root-associated microbiome as a water-stress-dependent trait. Environmental Microbiology, 17(2), 316–331. https://doi.org/10.1111/1462-2920.12439
Rubin, R. L., van Groenigen, K. J., & Hungate, B. A. (2017). Plant growth promoting rhizobacteria are more effective under drought: A meta-analysis. Plant and Soil, 416, 309–323. https://doi.org/10.1007/s11104-017-3199-8
Schimel, J. P., & Schaeffer, S. M. (2012). Microbial control over carbon cycling in soil. Frontiers in Microbiology, 3, 348. https://doi.org/10.3389/fmicb.2012.00348
Schütz, L., Gattinger, A., Meier, M., Müller, A., Boller, T., Mäder, P., & Mathimaran, N. (2018). Improving crop yield and nutrient use efficiency via biofertilization — A global meta-analysis. Frontiers in Plant Science, 8, 2204. https://doi.org/10.3389/fpls.2017.02204
Six, J., Bossuyt, H., Degryze, S., & Denef, K. (2004). A history of research on the link between (micro)aggregates, soil biota, and soil organic matter dynamics. Soil and Tillage Research, 79(1), 7–31. https://doi.org/10.1016/j.still.2004.03.008
Treseder, K. K. (2004). A meta-analysis of mycorrhizal responses to nitrogen, phosphorus, and atmospheric CO2 in field studies. New Phytologist, 164(2), 347–355. https://doi.org/10.1111/j.1469-8137.2004.01159.x
Vance, E. D., Brookes, P. C., & Jenkinson, D. S. (1987). An extraction method for measuring soil microbial biomass C. Soil Biology and Biochemistry, 19(6), 703–707. https://doi.org/10.1016/0038-0717(87)90052-6
Want this in PDF for your team? Download PDF. Want a 30-min consult on whether your soil and irrigation fit this protocol? Apply and we will run your case against ours, side by side. For the broader hub of soil-science material, see /soil-science.
Want a 30-minute consult on your land?
We respond within 24 hours and book a discovery call. We figure out whether your soil, water, and operation fit. If they do, we book the container.