How a tired field comes back — the realistic 3-season soil regeneration timeline
How a tired field comes back — the realistic 3-season soil regeneration timeline

The farmer who showed us his books is standing in a field of wheat in late afternoon. He has been growing on this hectare for eleven years. Three years ago he switched off imported NPK and onto a live-microbial input. The wheat is the same variety he has always planted. The drip lines are the same drip lines he laid in 2018. The labor schedule has not moved. Even the tractor passes are unchanged.
What is different is everything you cannot see from the road. His soil organic carbon has climbed from 0.6 percent to 1.4 percent. His water-holding capacity is meaningfully higher in the top 30 centimeters. His fertilizer spend per hectare per season is roughly half what it was. And the field next door, run by a neighbor on the old program, looks paler in the same week of the same season under the same sun.
He will tell you, if you ask, that the first season of the switch was the hardest one of his career. He will also tell you that he would not go back.
This post is about that timeline — what actually happens in soil biology when you stop force-feeding the plant and start feeding the soil. We will walk through season 1, season 2, and season 3 with honest numbers, and we will tell you what to measure at each step so you can see the curve in your own ground rather than taking anyone's word for it.
Why soil takes time
The reason there is no shortcut is that soil regeneration is microbial succession, and succession runs on a clock that biology, not impatience, sets.
When you reintroduce live biology onto a chemically suppressed soil, the first organisms to colonize are bacteria. They are fast, they are forgiving, and they multiply within hours. They are the early settlers — they break down residues, they begin nitrogen cycling, they take up the simple sugars and amino acids the plant exudes through its roots.
After bacteria come fungi, and fungi are slower. Mycorrhizal fungi in particular need physical continuity in the soil to spread their hyphal networks, and they need a host plant whose roots they can colonize. They do not show up in the first 30 days. They show up over the first 12 to 18 months.
Then come the structural aggregates. The "crumb" structure of healthy soil is built from microbial glues — extracellular polysaccharides, glomalin, decomposed root residues — laid down over multiple seasons. Aggregates are not a thing you add. They are a thing biology builds, slowly, given time and the right inputs.
Finally, full nutrient cycling. The closed loop where decomposers feed mineralizers feed plants feed root exudates feed decomposers. This is the steady state. Most operators reach a recognizable version of it in season 3. Some take four. None reach it in season 1, no matter what they spread.
The curve is well-documented in soil science going back decades. It is not optional. The good news is that it is also predictable, and the milestones along the way are observable if you know what to look for.
Season 1 — what to expect
The honest answer for season 1 is that yields hold or dip somewhere between 3 and 8 percent depending on starting condition. The tireder the soil, the deeper the dip can be, because the synthetic crutch is gone and the biological replacement has not yet built capacity. Soils with reasonable organic carbon to start often see no yield drop at all. Soils that have been chemically farmed for two decades may see closer to the high end of that range.
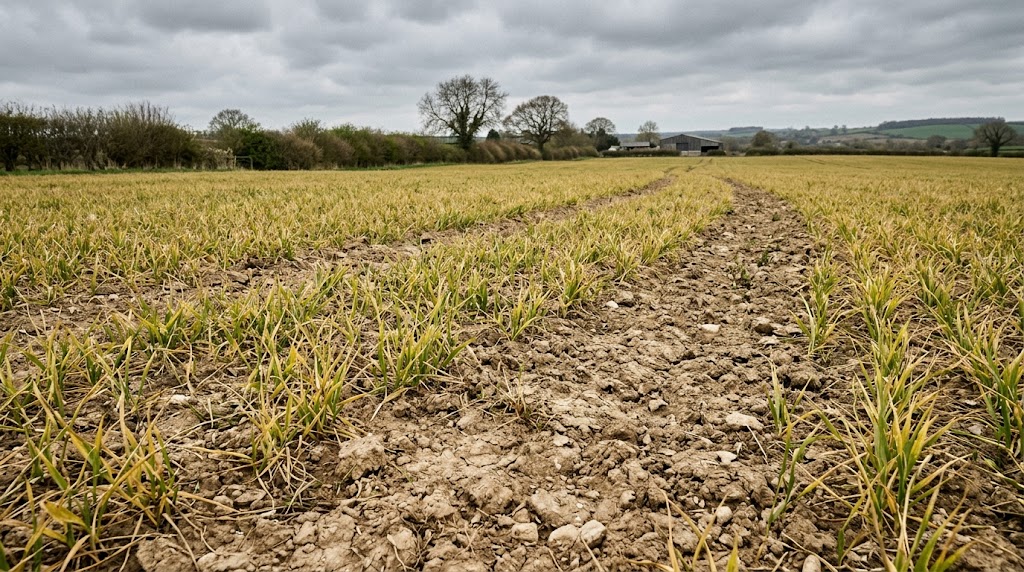
What you do see in season 1, often in the first 90 days, is improving water infiltration. Pour a liter of water onto the surface and time how long it takes to disappear. The number drops measurably as bacterial communities re-establish and start producing the polysaccharides that open up surface structure. Microbial biomass carbon — measurable from a soil sample sent to a lab — climbs visibly from baseline.
The temptation in season 1, and the most expensive mistake an operator can make, is to panic on the yield dip and add back synthetic NPK. This resets the experiment. The biology that is trying to colonize is salt-sensitive in its early stages, and a heavy synthetic application sets the colonization clock back by months. We have seen operators add a corrective synthetic dose in month four of season 1 and lose nine months of progress.
This is the season where you have to trust the math. If your starting condition tells you to expect a 5 percent dip, plan for it in your cash flow. Do not make it a six-figure surprise. The dip is the entry fee for getting season 2 and season 3 — and the entry fee is much smaller than what most operators pay in compounded synthetic input drift over a single bad price-spike year.
A useful frame: in season 1 you are not growing this season's crop. You are growing a soil microbiome. The crop is along for the ride.
Season 2 — the curve bends
This is the season where most operators stop being nervous.
Compaction starts to ease — you can feel it under a probe, you can see it in tractor draft, and your equipment burns slightly less fuel doing the same passes. Organic carbon climbs measurably from baseline, often by 0.2 to 0.4 percentage points in the top 30 centimeters. That is a significant move in soil-science terms, even though it sounds small in dinner-table terms.
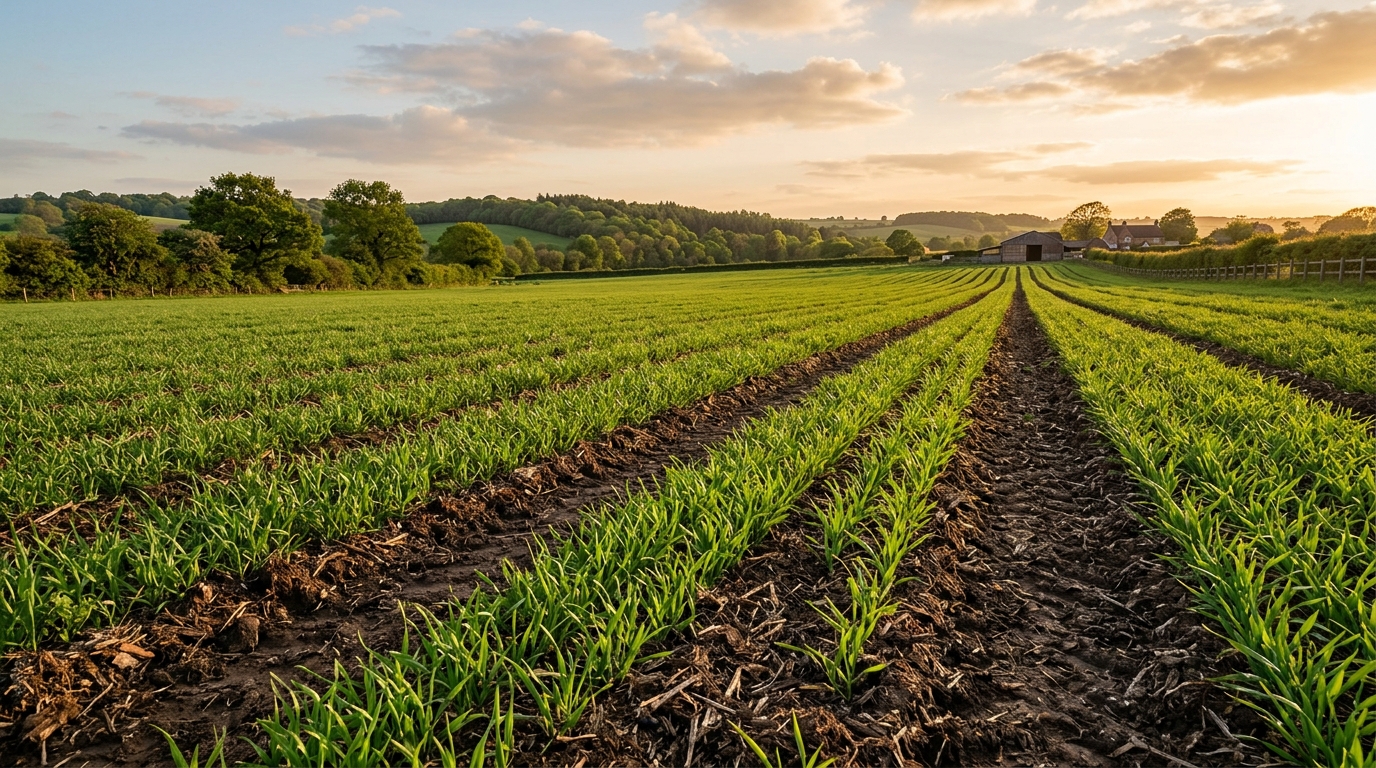
Yield typically hits or slightly exceeds the historical baseline. The synthetic-fertilizer requirement, if you have been blending biology with a tapered synthetic dose, falls 20 to 40 percent for the same yield outcome in target crops with pre and post measured. Many operators stop the synthetic blend entirely partway through season 2 once the biology has visibly taken over.
The other thing that starts to show up in season 2, particularly in arid contexts, is the water bill. Better infiltration and better aggregate stability mean a higher fraction of every irrigation goes to the root zone instead of running off the surface or draining past it. Operators with metered irrigation on a 50-hectare plot start seeing four-figure or low-five-figure dirham savings on the water line of their P&L. It is not the headline number, but it is real cash, and it shows up every billing cycle.
Season 2 is also when the soil starts looking different to the eye. A handful of soil from a season-2 field crumbles in your fingers in a way that a chemically-farmed field nearby does not. Roots in season 2 fields tend to be visibly thicker, fuzzier with root hairs, and deeper.
See the AED/hectare math →
Season 3 — the new normal
Season 3 is where the math turns.
Yield-per-applied-liter of irrigation water — which is the metric that actually matters in arid agriculture — crosses the chemical baseline. Most operators see a measurable lift of 8 to 18 percent on this metric in target crops, pre and post measured, depending on starting condition and crop selection. Soil aggregate stability is visibly different on a simple crumb test: drop a soil pellet into a glass of water and watch what happens. Season 1 soil falls apart. Season 3 soil holds its shape for hours.
Most operators stop synthetic supplementation entirely in season 3, with the exception of crop-specific spot applications — a calcium top-up on tomato, a potassium boost on a heavy potato season. The base fertility program is biological. The synthetic, if it shows up at all, is a precision tool used in grams per hectare, not bags.
Fertilizer cost per hectare per season is, for most operators, roughly half what it was at baseline. Sometimes less. The savings compound because they show up every season, not just once.
The phrase we hear most in season 3 from operators who have been through it is "the soil is doing the work now." Which is exactly what was supposed to happen. A regenerated soil does not need to be fed bag by bag from a foreign supply chain. It needs a low-maintenance live-microbial input layered onto a biology that has rebuilt itself.
The first season costs you trust. The third season pays it back with interest.
What to measure each season
You do not need a soil-science PhD to track this. You need four numbers, taken at four time points: baseline, 12 months, 24 months, 36 months. Send samples to a credible lab. The lab cost is trivial relative to the input bill you are reshaping.
The four core measurements:
- Soil organic carbon (%). The single best proxy for soil health over time. Walmart-cheap to measure. Climbs steadily through the transition.
- Microbial biomass carbon. Tells you whether biology is actually colonizing or whether you are spreading product onto sterile ground. Should climb visibly by the end of season 1.
- Single-ring infiltration rate. A field test you can do yourself with a metal ring and a stopwatch. Improves first.
- Yield per applied liter of irrigation. The P&L number. This is the one that matters at the bank.
Add a fifth if you can: fertilizer cost per hectare per season, broken out by input type. Most operators do not track this cleanly. You should. It is the line that changes the most.
Honest caveats
We are not selling this as a free lunch. Three honest qualifications, because operators who skip them get unhappy surprises:
Starting condition matters. A field that has been chemically farmed for 20 years on heavy clay with low organic matter takes longer to rebuild than a field that has been on a moderate program for ten. Plan for season 4 in the worst cases. The end state is the same — the curve is just stretched.
Climate matters. Cold-season recovery is slower because microbial activity is temperature-dependent. Operators in the UAE, Saudi, and the wider Gulf get the fastest curves we see. Mediterranean and tropical regions are close behind. Continental winters add a season to the timeline.
Crop choice matters. Perennials respond faster than annuals in years 1 and 2 because the root system is continuous and gives biology a stable host. Do not plant the most demanding crop you have ever grown in season 1. Use season 1 for a familiar, forgiving crop. Save the premium high-demand crop for season 2 or 3 when the soil is ready.
If you cut the corners on any of those three, you will get a longer curve and more frustration. Match the timeline to your conditions, do not fight them.
Coming back from tired
The arithmetic of soil regeneration is unkind in season 1 and generous in season 3. Most operators who start the transition do so because the alternative — staying on a compounding imported NPK bill — is worse. By the time they are 36 months in, they tell us the same thing the farmer with the wheat field told us: they would not go back.
The closest companion piece to this one is the post on water — because regenerated soil is, in arid agriculture, primarily a water story. Read water that stays where you put it next. If you want to see the regeneration curve translated into AED per hectare and AED per kilogram of yield, the math page walks the scenario end to end. And if you want to start, apply for a container and we will run a soil sample from your land against ours, side by side.
The tired field comes back. It just takes the seasons it takes.
Ready to put one on your land?
We respond within 24 hours and book a 30-minute discovery call. We figure out whether your land, water, and operation fit. If they do, we book the container.